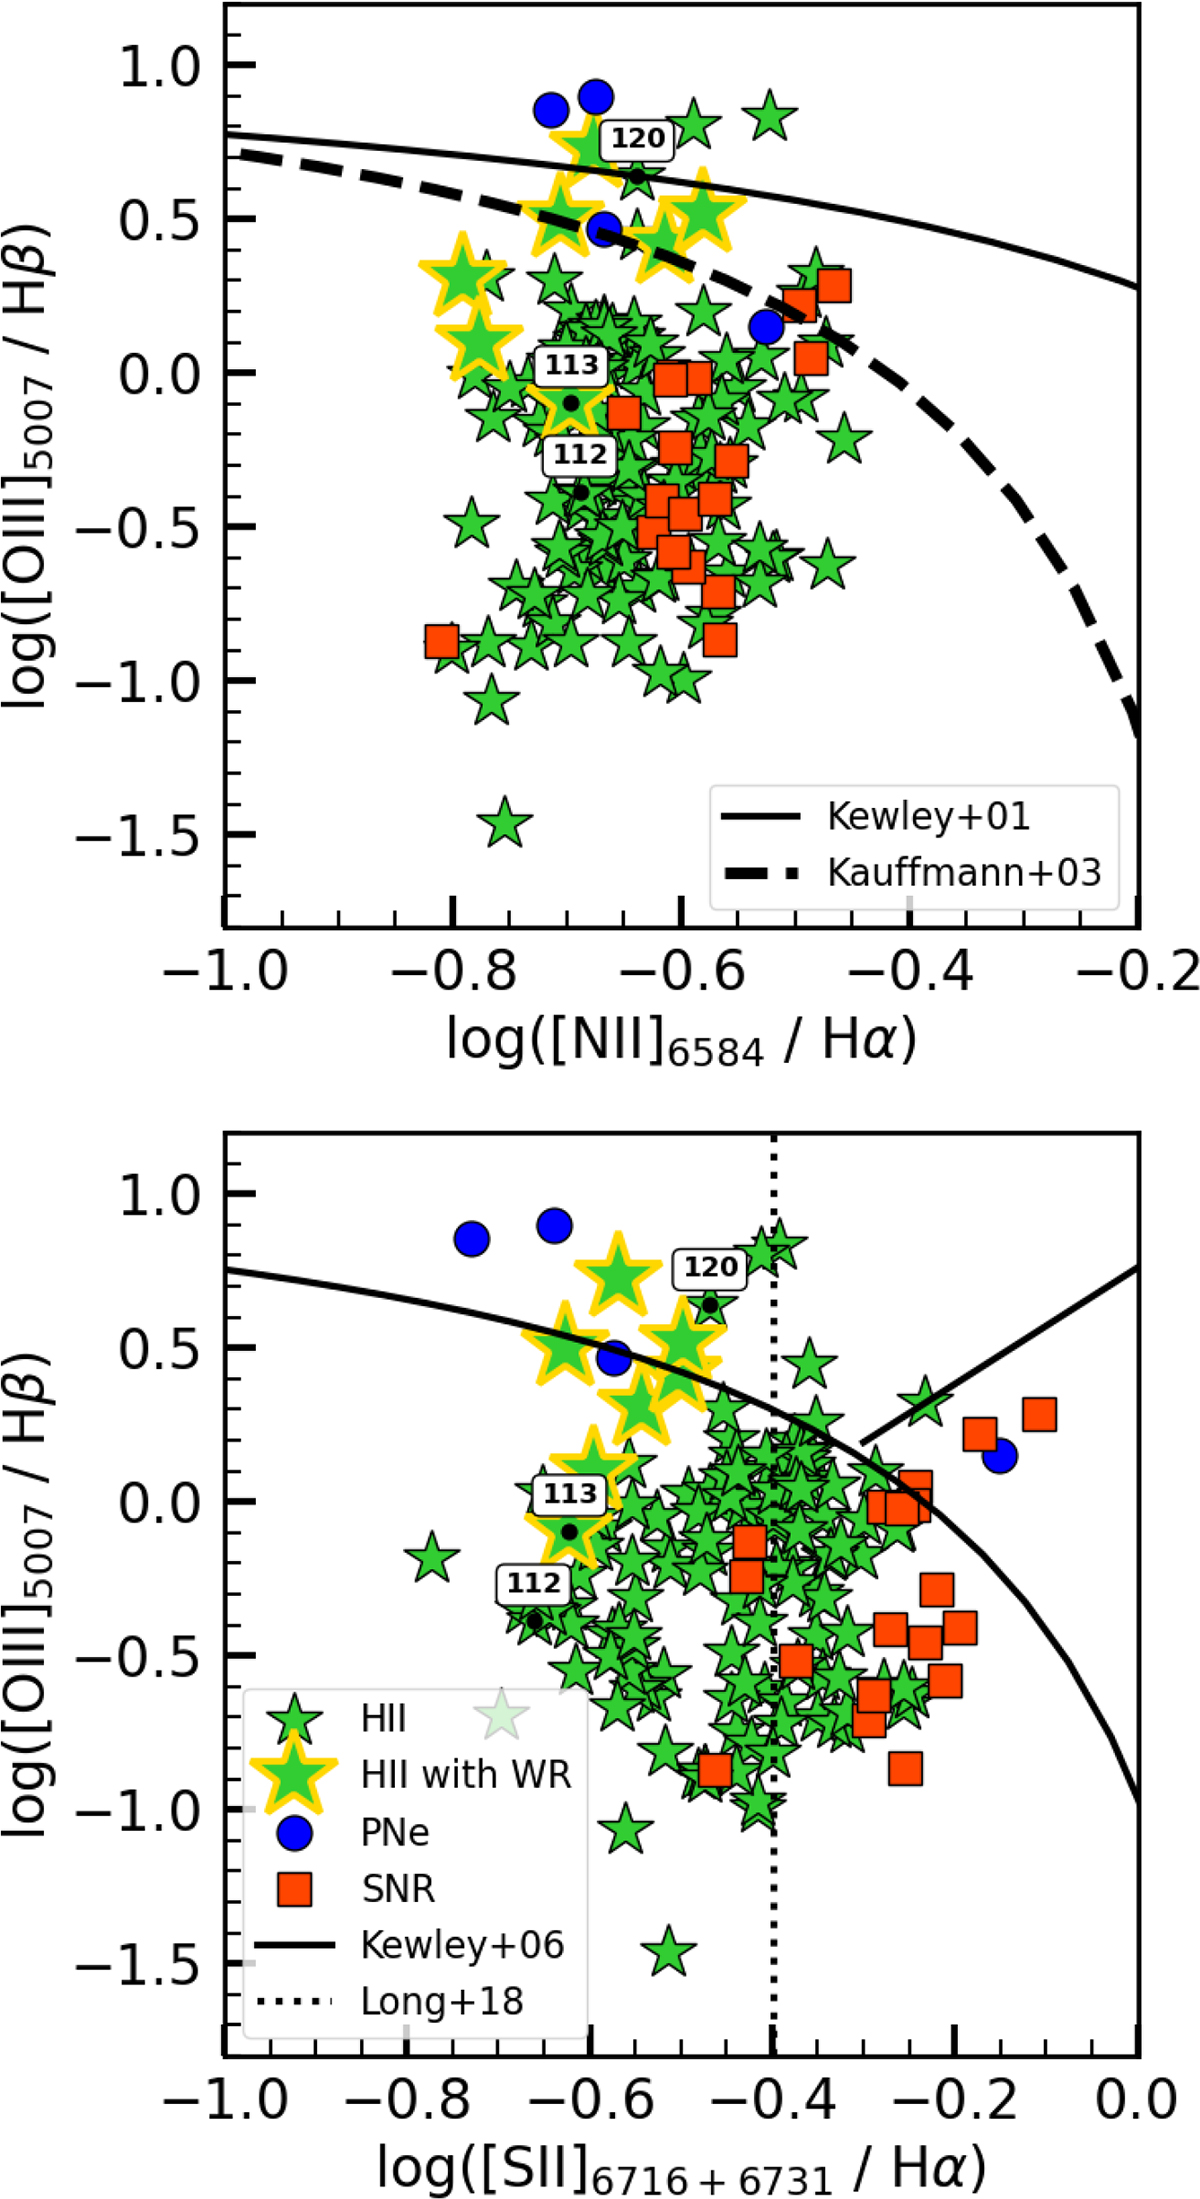
Fig. 3.
Download original image
Optical O III/Hβ versus N II/Hα (top) and S II/Hα (bottom) diagnostic diagrams from Baldwin et al. (1981) and Veilleux & Osterbrock (1987), respectively. Continuous and dashed curves show the demarcation criteria by Kewley et al. (2001, 2006) and Kauffmann et al. (2003), respectively. The dotted line indicates the traditional S II/Hα cutoff of 0.4 for SNR (e.g. Long et al. 2018). Green stars are the integrated measurements of H II regions, blue circles of PNe and red squares of SNRs as labelled in the legend. The H II regions with yellow edges host WR stars. Black dots indicate the position in the diagram of three H II regions (IDs 112, 113 and 120) which are discussed in more details in Sect. 4.3.
Current usage metrics show cumulative count of Article Views (full-text article views including HTML views, PDF and ePub downloads, according to the available data) and Abstracts Views on Vision4Press platform.
Data correspond to usage on the plateform after 2015. The current usage metrics is available 48-96 hours after online publication and is updated daily on week days.
Initial download of the metrics may take a while.