Fig. 4.
Download original image
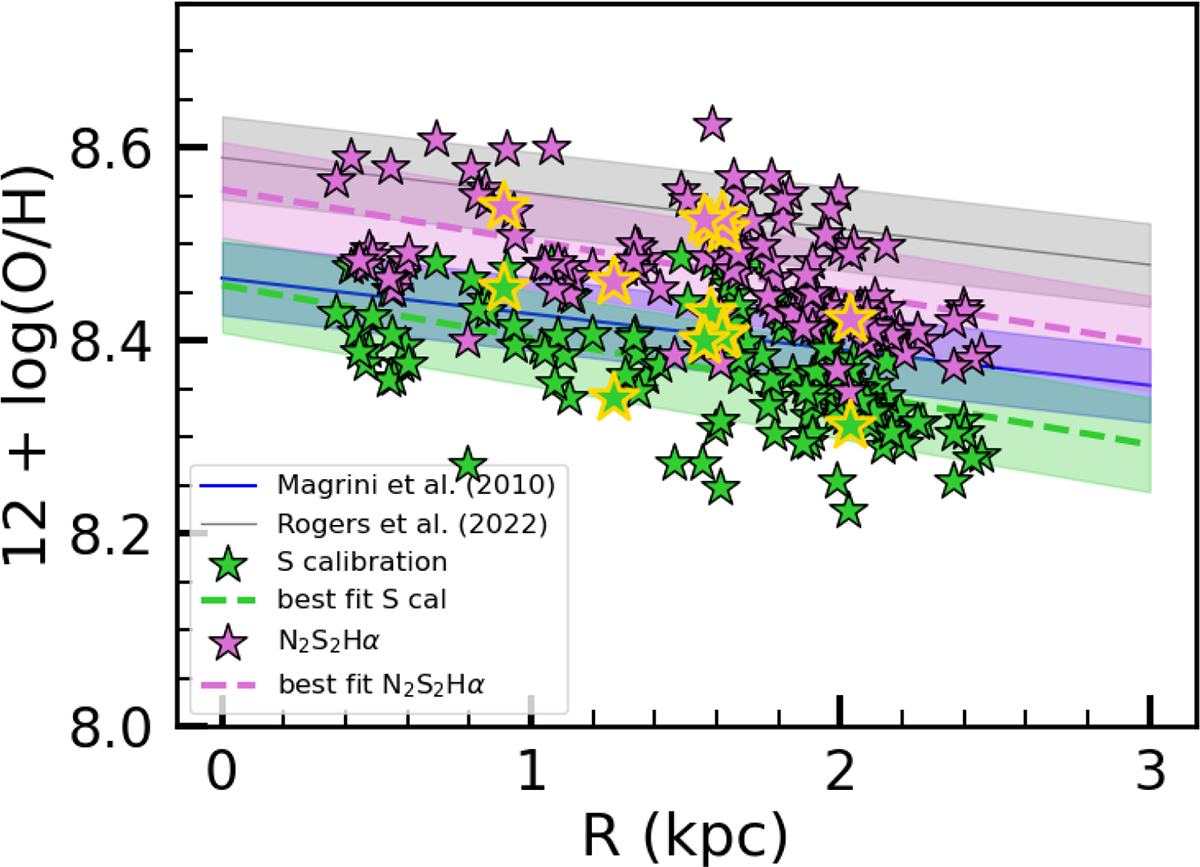
Metallicity gradients inferred from the Pilyugin & Grebel (2016) S-calibration (green) and the N2S2Hα (violet) from Brazzini et al. (2024). The dashed green and violet lines indicate the best-fits to our data, and the shaded area indicates the 1-σ scatter. Blue and gray lines and shaded areas are the gradients obtained from direct oxygen abundance measurements by Magrini et al. (2010) and Rogers et al. (2022), respectively. The stars yellow-edged stars are H II regions hosting WR stars.
Current usage metrics show cumulative count of Article Views (full-text article views including HTML views, PDF and ePub downloads, according to the available data) and Abstracts Views on Vision4Press platform.
Data correspond to usage on the plateform after 2015. The current usage metrics is available 48-96 hours after online publication and is updated daily on week days.
Initial download of the metrics may take a while.