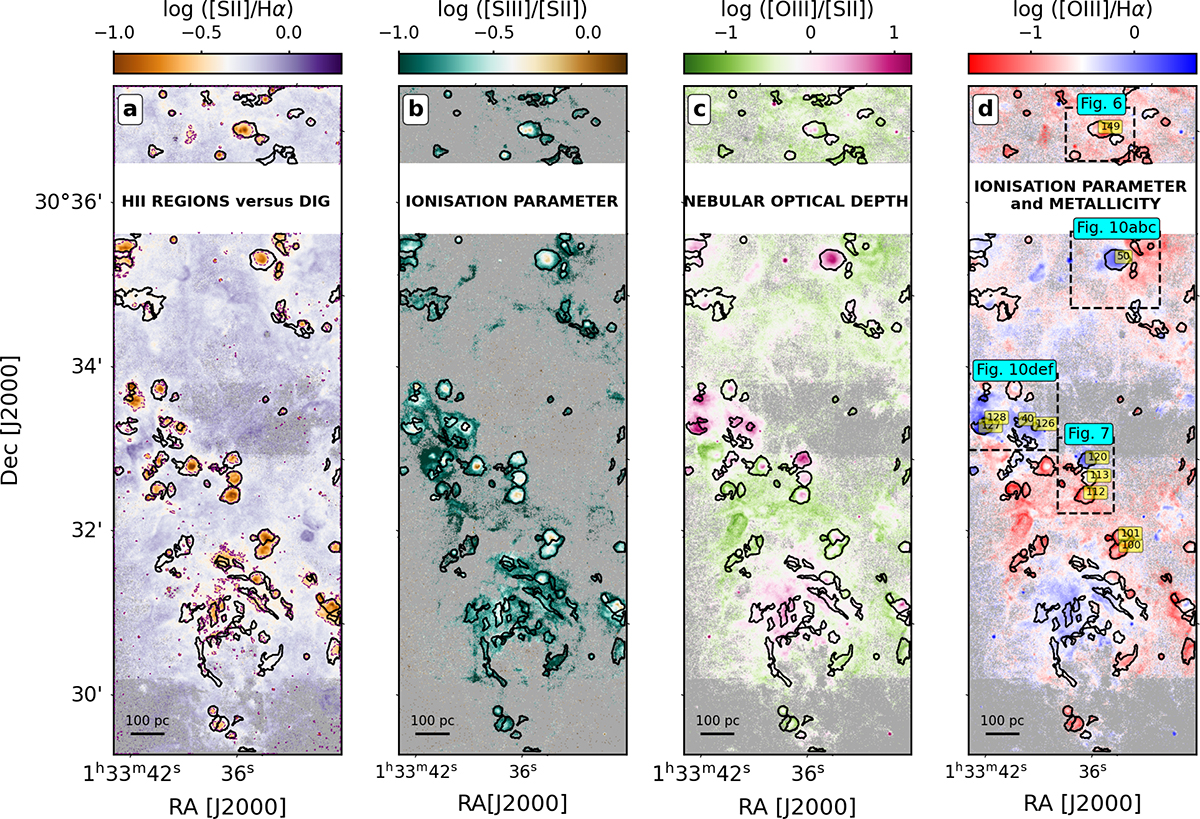
Fig. 5.
Download original image
Line-ratio maps, corrected for dust attenuation, of our M33 data for a S/N of the lines of interest larger than 2.5. From left to right: [S II]λ6716, 6731/Hα, [S III]λ9069/[S II]λ6716, 6731, [O III]λ5007/[S II]λ6716, 6731, and [O III]λ5007/Hα. Black contours indicate the dendrograms classified as H II regions. In the S II/Hα maps (panel a), the purple dashed contours show the level value of 0.35.
Current usage metrics show cumulative count of Article Views (full-text article views including HTML views, PDF and ePub downloads, according to the available data) and Abstracts Views on Vision4Press platform.
Data correspond to usage on the plateform after 2015. The current usage metrics is available 48-96 hours after online publication and is updated daily on week days.
Initial download of the metrics may take a while.