Fig. 7.
Download original image
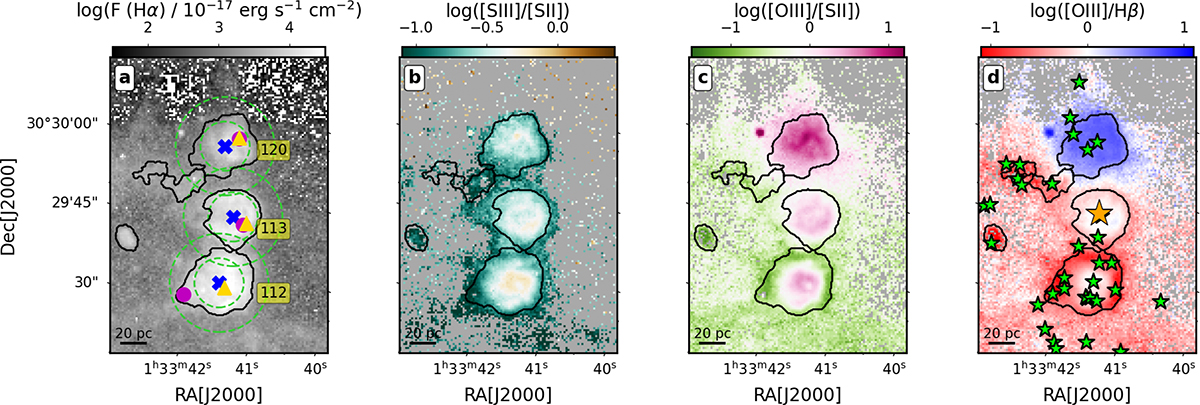
Zoom-in line-ratio maps of three example H II regions (IDs 112, 113 and 120 from bottom to top). From left to right: Maps of Hα flux, S III/S II, O III/S II, and O III/Hβ ratios. In panel a, the blue crosses are the geometrical centroids of the nebular mask, the magenta circles, and the green triangles indicate the peaks of the Hα and O III emission within the nebular mask, respectively. The dashed green apertures have a radius of 5 and 10″, respectively. In panel d, green and orange stars indicate massive stars (Sect. B.1) and WR stars (Sect. B.2), respectively.
Current usage metrics show cumulative count of Article Views (full-text article views including HTML views, PDF and ePub downloads, according to the available data) and Abstracts Views on Vision4Press platform.
Data correspond to usage on the plateform after 2015. The current usage metrics is available 48-96 hours after online publication and is updated daily on week days.
Initial download of the metrics may take a while.