Open Access
Fig. 8.
Download original image
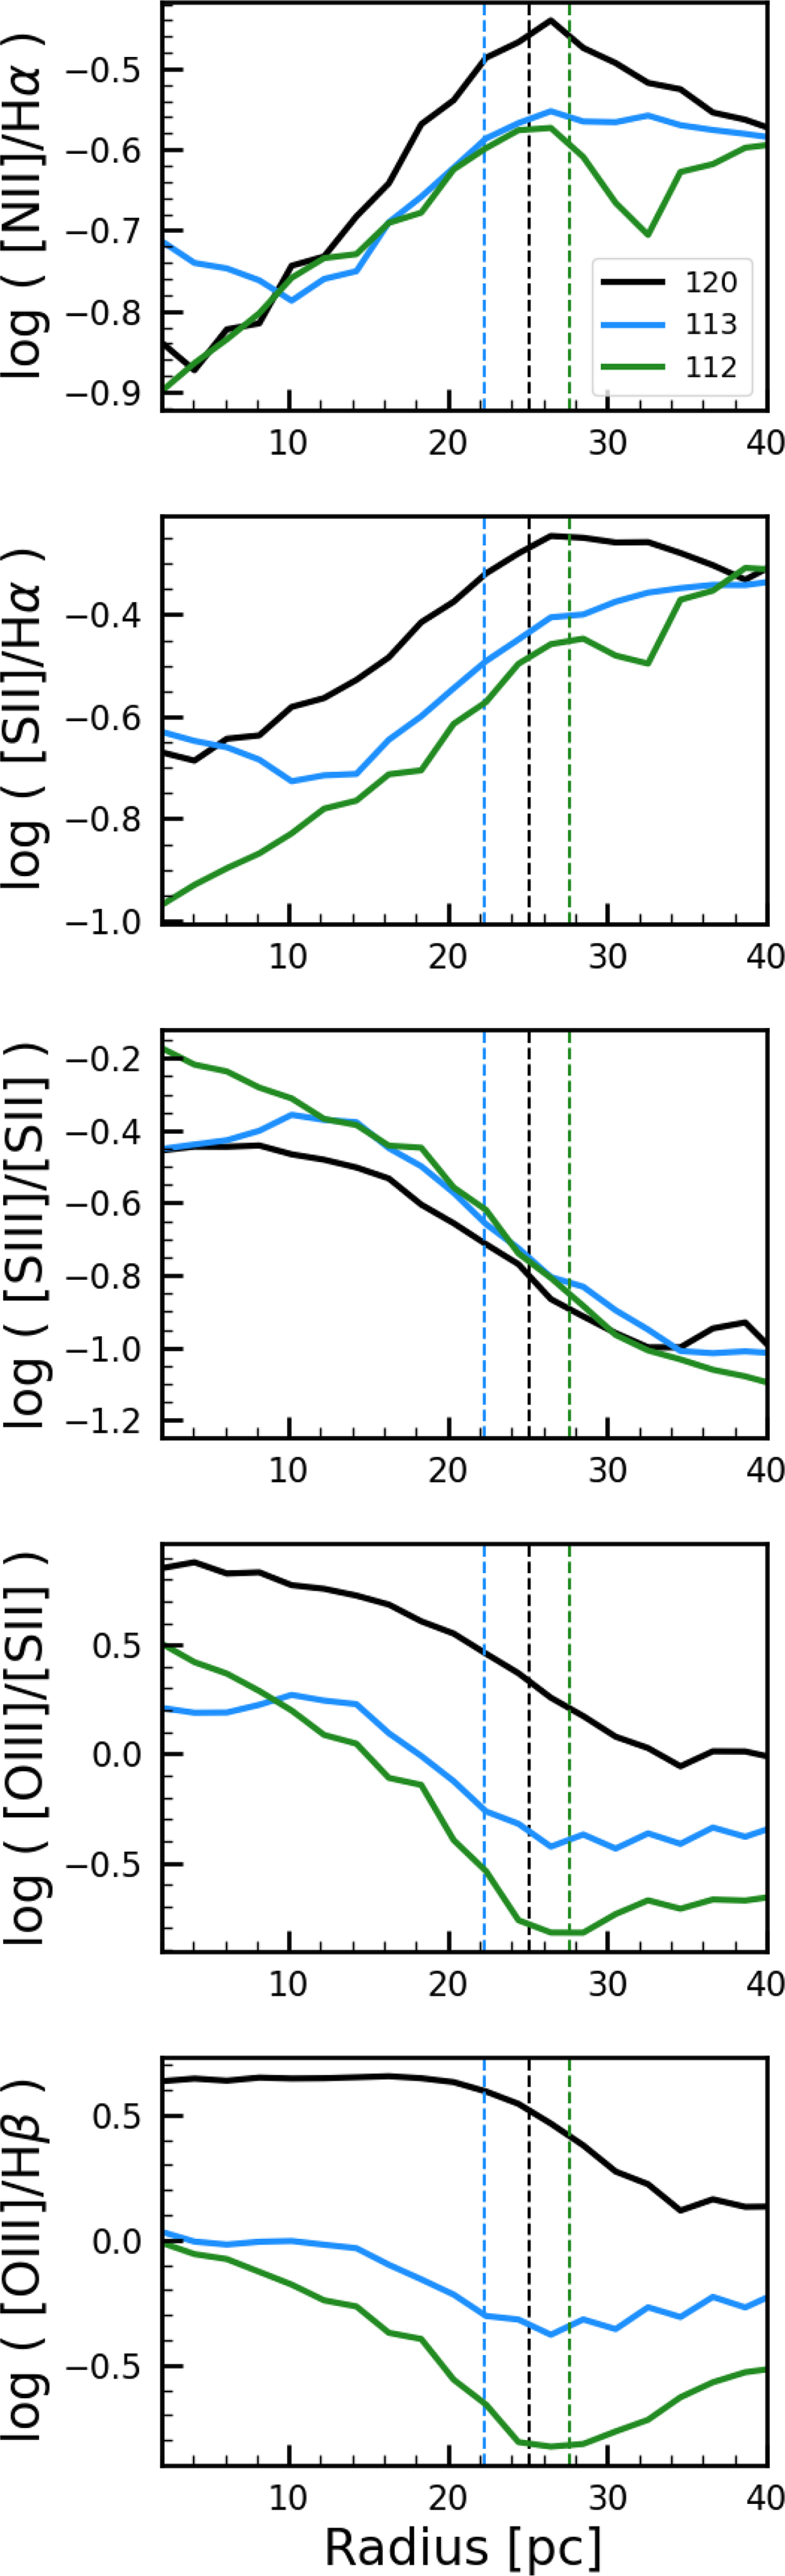
Radial profiles of the N II/Hα, S II/Hα, S III/S II, O III/S II, and O III/Hβ ratios. Three different H II regions (IDs 112, 113, 120) are represented by different colours as labelled in the legend. Dashed vertical lines represent the sizes of the nebular masks defined in Sect. 3.1.
Current usage metrics show cumulative count of Article Views (full-text article views including HTML views, PDF and ePub downloads, according to the available data) and Abstracts Views on Vision4Press platform.
Data correspond to usage on the plateform after 2015. The current usage metrics is available 48-96 hours after online publication and is updated daily on week days.
Initial download of the metrics may take a while.