Open Access
Fig. 1
Download original image
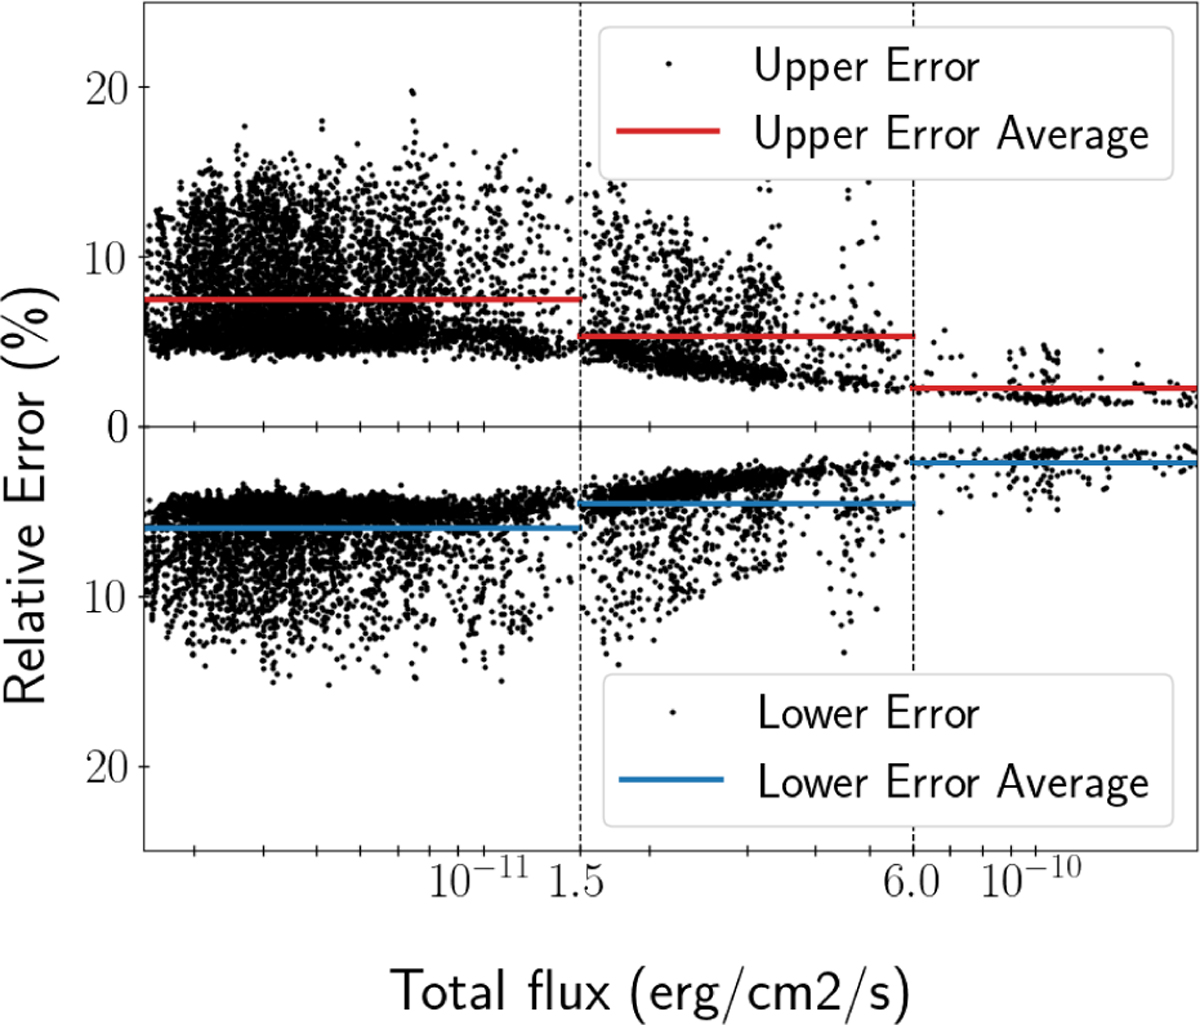
Upper and lower relative errors on the total integrated X-ray flux as a function of total flux for the three-temperature model. Vertical dashed lines delimit the ranges selected by eye. Red and blue segments represent the average errors in the corresponding ranges.
Current usage metrics show cumulative count of Article Views (full-text article views including HTML views, PDF and ePub downloads, according to the available data) and Abstracts Views on Vision4Press platform.
Data correspond to usage on the plateform after 2015. The current usage metrics is available 48-96 hours after online publication and is updated daily on week days.
Initial download of the metrics may take a while.