Fig. A.2
Download original image
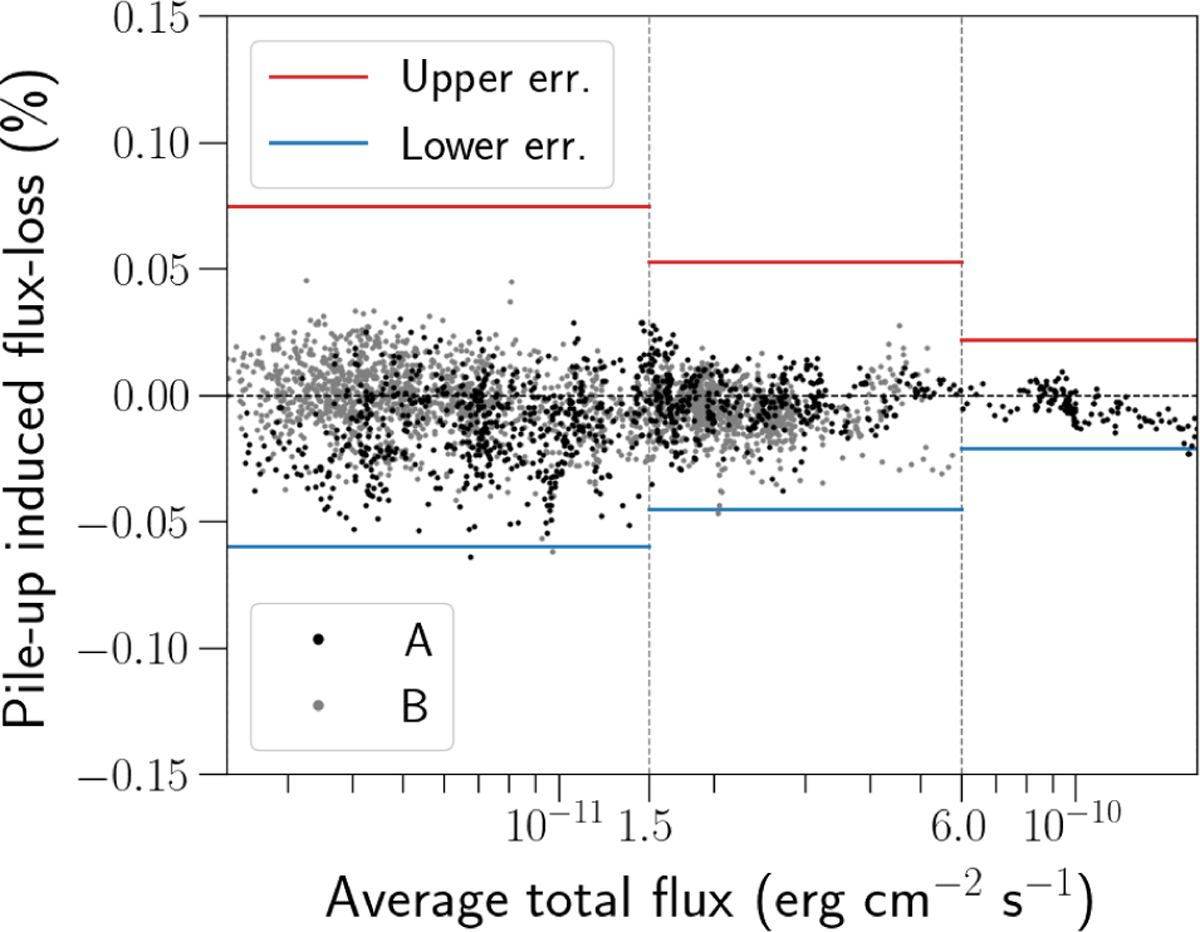
Comparison between fluxes obtained without correcting for pile-up and correcting by selecting only single patterns. Pile-up induced flux-loss defined as (1 – NOCORR/STDCORR) is plotted with black and gray dots over the total flux. Black dots represent intervals of the observation with id 0049350101, which was observing with pn in the small-frame mode. The gray dots are used for all the other observations observed with the standard frame time. Relative upper and lower total flux 1σ errors from the reduction procedure are depicted as red and blue segments for the same flux ranges as in Figure 1.
Current usage metrics show cumulative count of Article Views (full-text article views including HTML views, PDF and ePub downloads, according to the available data) and Abstracts Views on Vision4Press platform.
Data correspond to usage on the plateform after 2015. The current usage metrics is available 48-96 hours after online publication and is updated daily on week days.
Initial download of the metrics may take a while.