Open Access
Fig. 2
Download original image
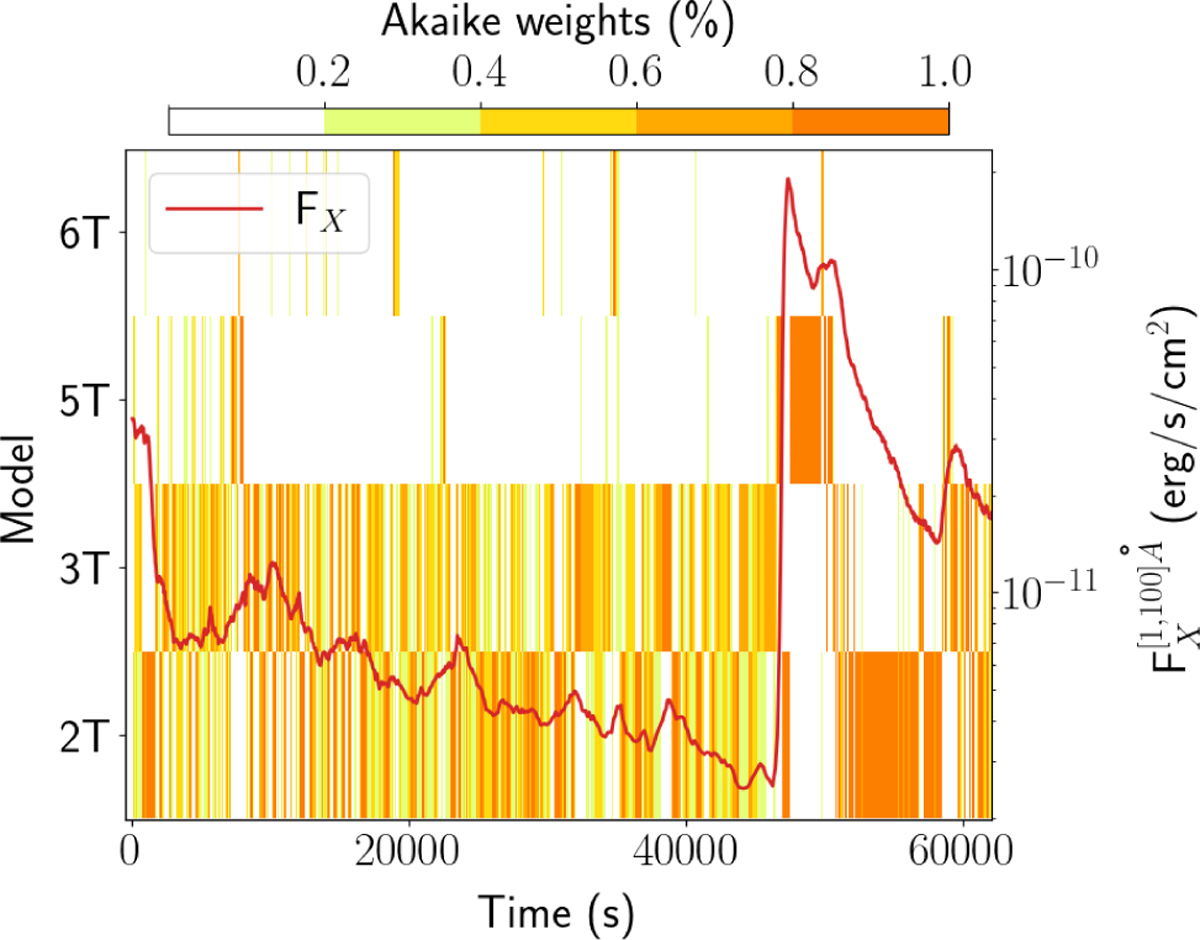
Comparison of ωi for the different intervals of observation 0049350101. The left axis represents the model; the right axis shows the wavelength-integrated flux light curve ([1, 100] Å). The values of the Akaike weights for each model as a function of time are color coded as indicated by the color bar.
Current usage metrics show cumulative count of Article Views (full-text article views including HTML views, PDF and ePub downloads, according to the available data) and Abstracts Views on Vision4Press platform.
Data correspond to usage on the plateform after 2015. The current usage metrics is available 48-96 hours after online publication and is updated daily on week days.
Initial download of the metrics may take a while.