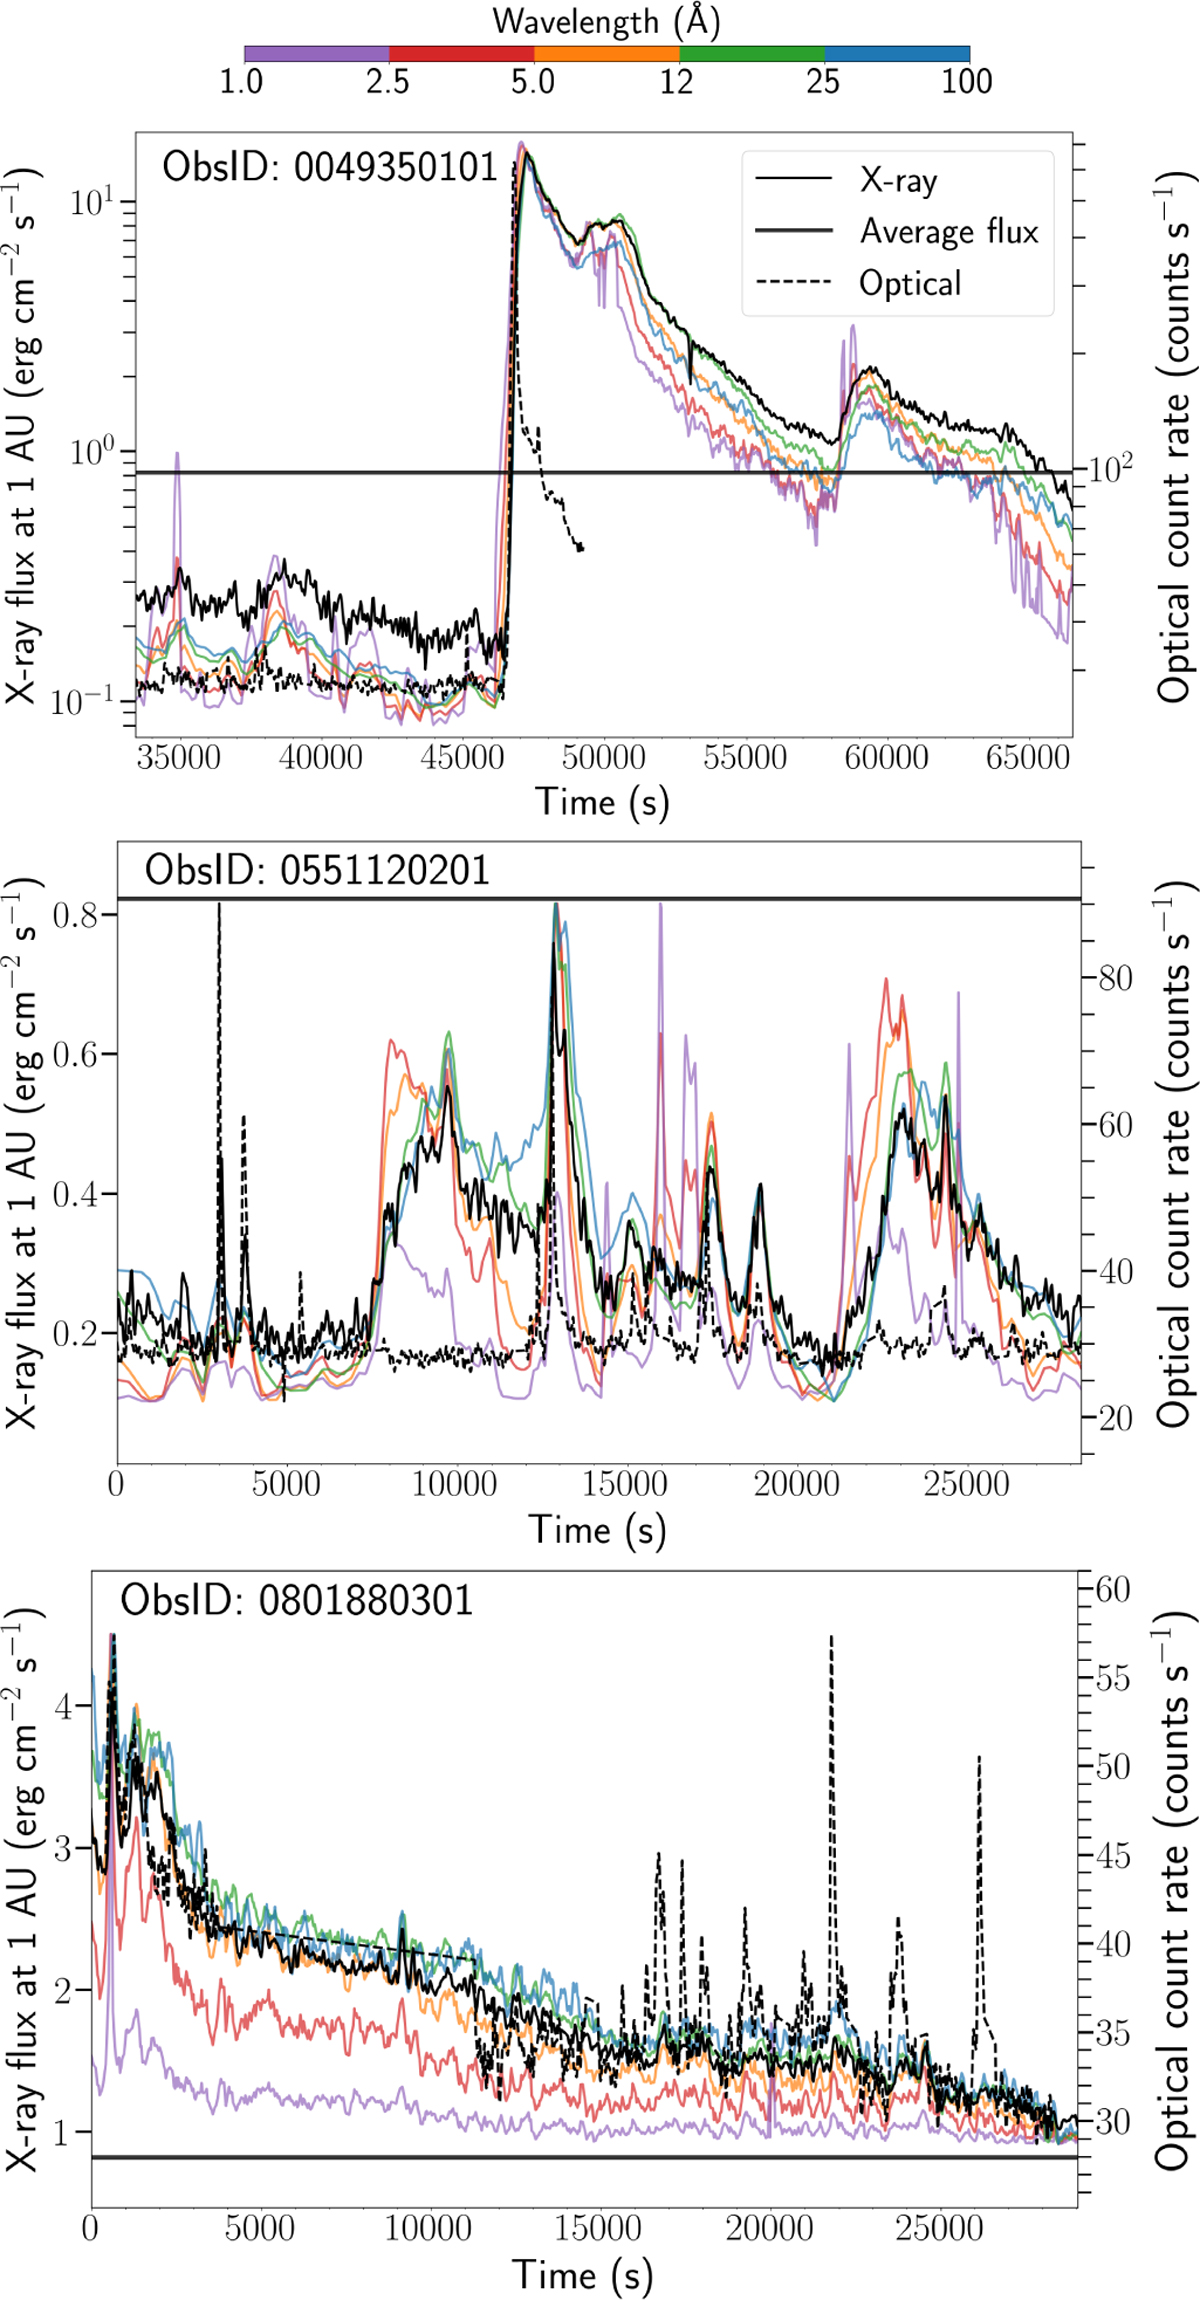
Fig. 4
Download original image
X-ray flux (1−100 Å; count s−1; solid black line) plotted for selected snapshot observations together with the X-ray average over all observations. The optical count rate is plotted as a dashed black line. Colored lines (see the color bar at the top panel) indicate light curves in different energy bands, obtained by integrating the spectral fluxes. No axis labels or ticks are displayed for these, as they are plotted only for qualitative comparison. Limits are set to (0.8 × min, 1.2 × max) separately for each band.
Current usage metrics show cumulative count of Article Views (full-text article views including HTML views, PDF and ePub downloads, according to the available data) and Abstracts Views on Vision4Press platform.
Data correspond to usage on the plateform after 2015. The current usage metrics is available 48-96 hours after online publication and is updated daily on week days.
Initial download of the metrics may take a while.