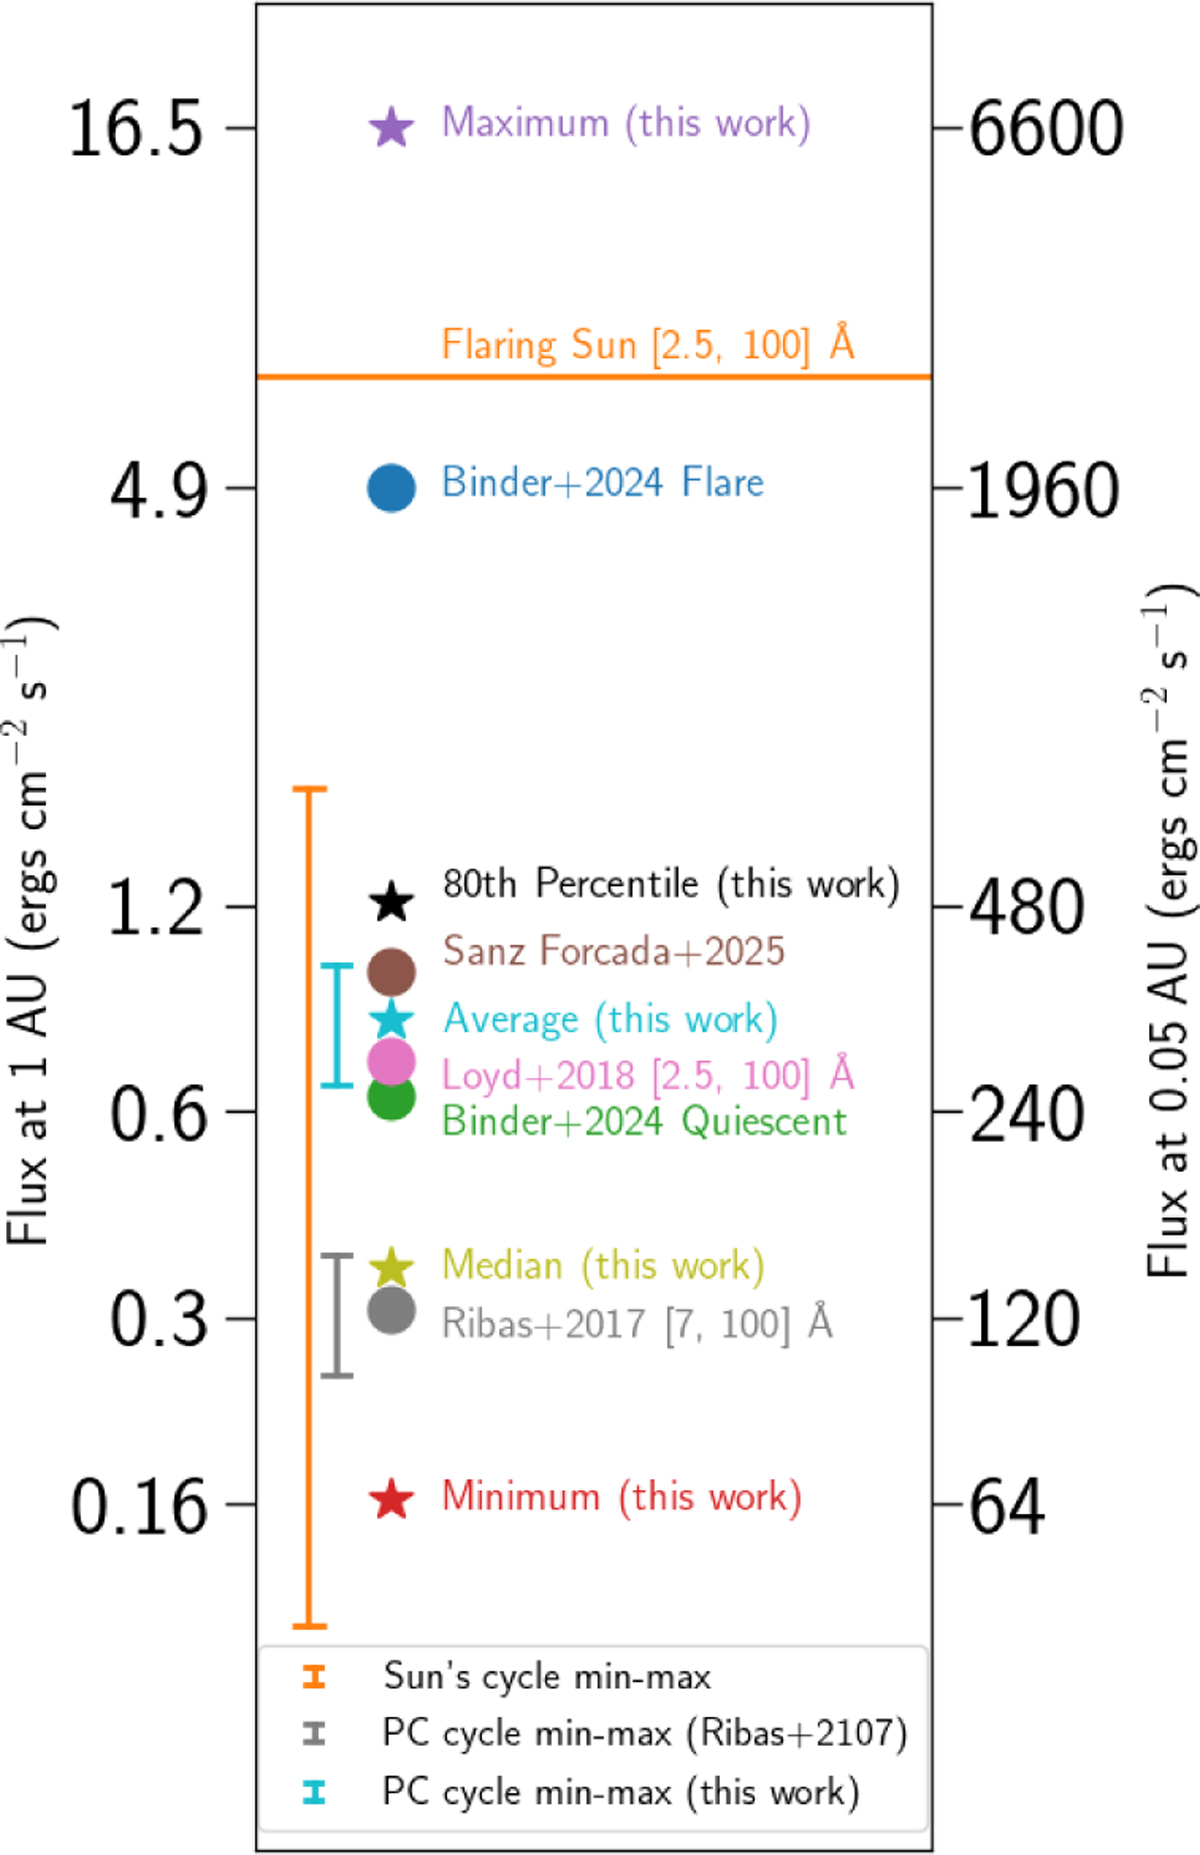
Fig. 7
Download original image
Integrated fluxes at 1 AU (right-side axis) and at 0.05 AU (left-side axis, corresponding to the orbital distance of Prox Cen b). When not included in the figure, the integration range is [1, 100] Å. Star-shaped markers indicate results from this work, while round markers indicate results from other works. For the Sun (integrated over [4.1, 100] Å), the variability range over its activity cycle in quiescence and a flaring reference are taken from Peres et al. (2000). Assuming a cycle maximum-to-minimum ratio of 1.5 for Prox Cen (Wargelin et al. 2024), we show the star’s quiescent variability due to its activity cycle. To provide a reference for the amplitude of the activity cycle on the plot, we use two example spectra, the Ribas et al. (2017) spectrum (gray) and our average spectrum (azure), as mid-cycle quiescent flux references.
Current usage metrics show cumulative count of Article Views (full-text article views including HTML views, PDF and ePub downloads, according to the available data) and Abstracts Views on Vision4Press platform.
Data correspond to usage on the plateform after 2015. The current usage metrics is available 48-96 hours after online publication and is updated daily on week days.
Initial download of the metrics may take a while.