Table 4
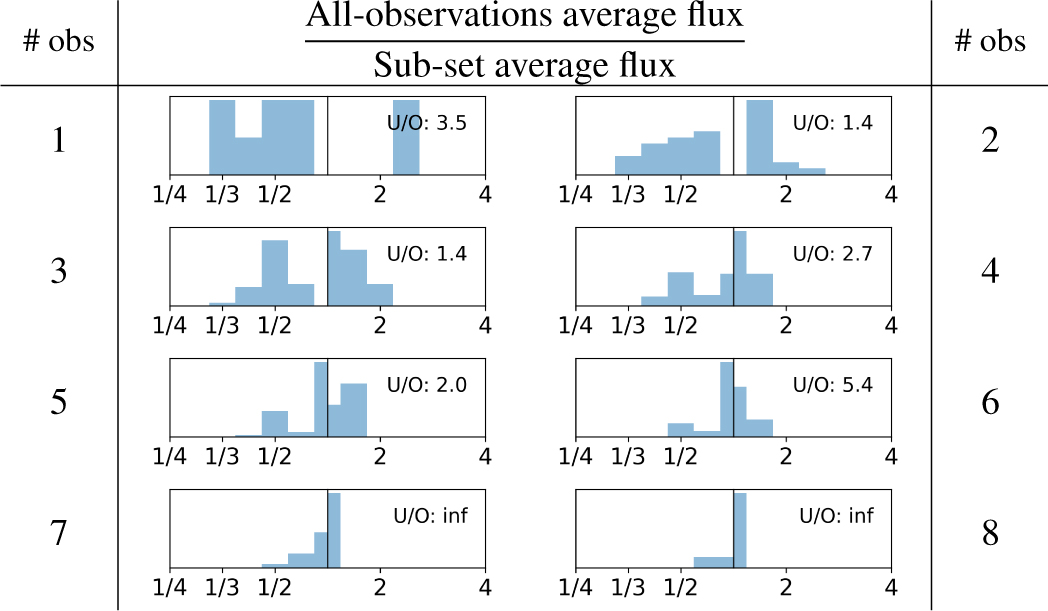
Ratio between the average flux over all eight observations (the first one is split in two) and that obtained by randomly sampling a given number of observations (considering all possible combinations without repetition).
| # obs | All-observations average flux Sub-set average flux | # obs |
|---|---|---|
 |
||
Notes. The vertical line at the center represents unity. Values to its left indicate underestimation, while values to its right indicate overestimation. The ratio of underestimating to overestimating cases is reported as U/O. Cases falling within the −1 to 1 bins are excluded from this ratio.
Current usage metrics show cumulative count of Article Views (full-text article views including HTML views, PDF and ePub downloads, according to the available data) and Abstracts Views on Vision4Press platform.
Data correspond to usage on the plateform after 2015. The current usage metrics is available 48-96 hours after online publication and is updated daily on week days.
Initial download of the metrics may take a while.