Fig. C.1.
Download original image
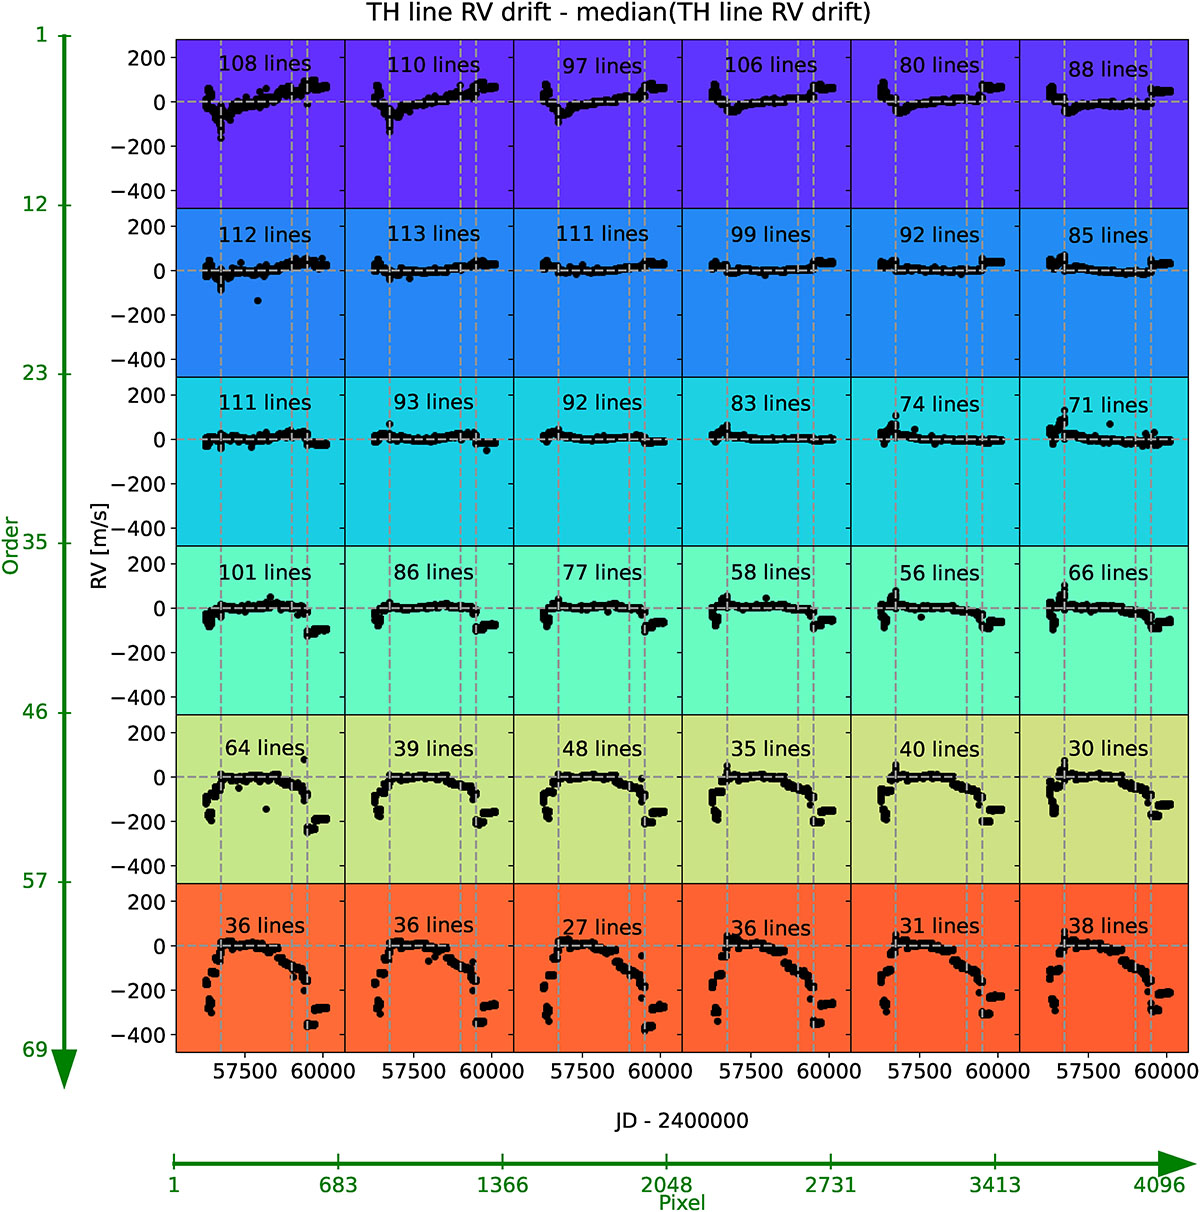
Drift of TH lines as a function of time for different regions on the detector. The green axis on the left and at the bottom of the plot gives the delimitation in order and pixel of each detector region, respectively. Each subplot shows the weighted average velocity drift of the TH lines falling in a specific region of the detector once the overall drift of all TH lines has been removed (shown in the top panel of Fig. 1). The text in each subplot gives the number of TH lines falling in each specific region. The dashed vertical lines correspond, from left to right, to a modification of the HARPS-N focus, the change of the TH-AR HC lamp used for wavelength solution, and the replacement of the detector cryostat. The blue and red edges show strong long-term deviations, likely due to significant LSF variation in those regions over time, in addition to significant jumps at the focus change and cryostat replacement.
Current usage metrics show cumulative count of Article Views (full-text article views including HTML views, PDF and ePub downloads, according to the available data) and Abstracts Views on Vision4Press platform.
Data correspond to usage on the plateform after 2015. The current usage metrics is available 48-96 hours after online publication and is updated daily on week days.
Initial download of the metrics may take a while.