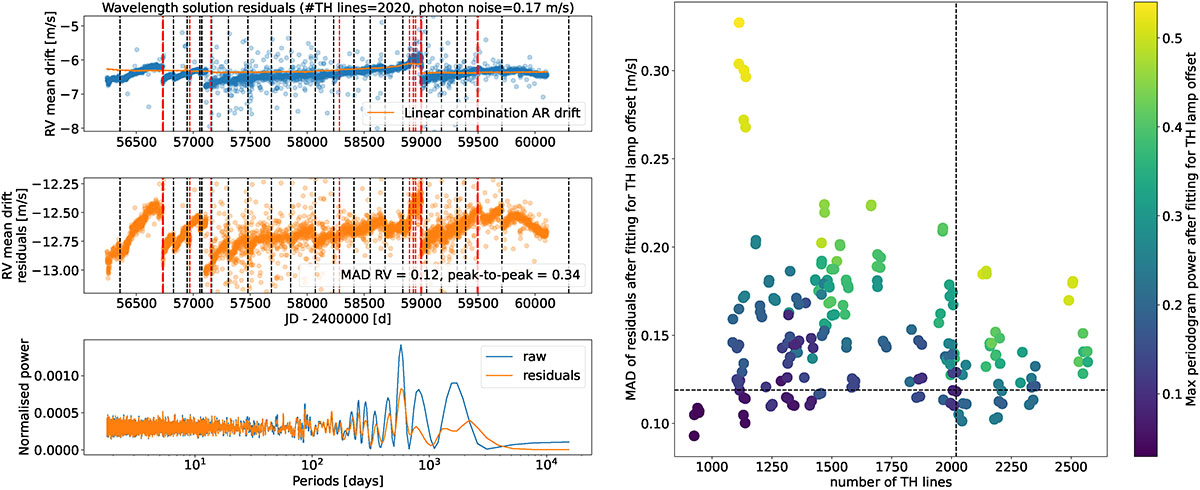
Fig. C.2.
Download original image
Left: Wavelength solution residuals for our best selection of TH lines. A wavelength solution residual is the difference between the known wavelength of TH lines (as shown in Table D.1) and the wavelengths obtained from a derived wavelength solution. Top left: Mean RV drift of wavelength solution residuals though time in blue. The orange curve corresponds to the best-fitted linear model of the AR drift shown in the middle panel of Fig. 1 to account for the drift of TH lines with respect to lamp aging. The residuals after this curve have been removed are shown in the middle left panel. Bottom left: Periodogram of the mean RV drift and mean RV drift residuals. Right: Median absolute deviation of mean RV drift residuals as a function of the number of lines selected for deriving a wavelength solution. The colour coding highlights the power of the maximum peak found in the periodogram of the mean RV drift residuals. The dashed lines points to the best selection of TH line used for deriving the HARPS-N wavelength solutions used for reducing the solar data. The left panel shows the wavelength solution residuals for that selection.
Current usage metrics show cumulative count of Article Views (full-text article views including HTML views, PDF and ePub downloads, according to the available data) and Abstracts Views on Vision4Press platform.
Data correspond to usage on the plateform after 2015. The current usage metrics is available 48-96 hours after online publication and is updated daily on week days.
Initial download of the metrics may take a while.