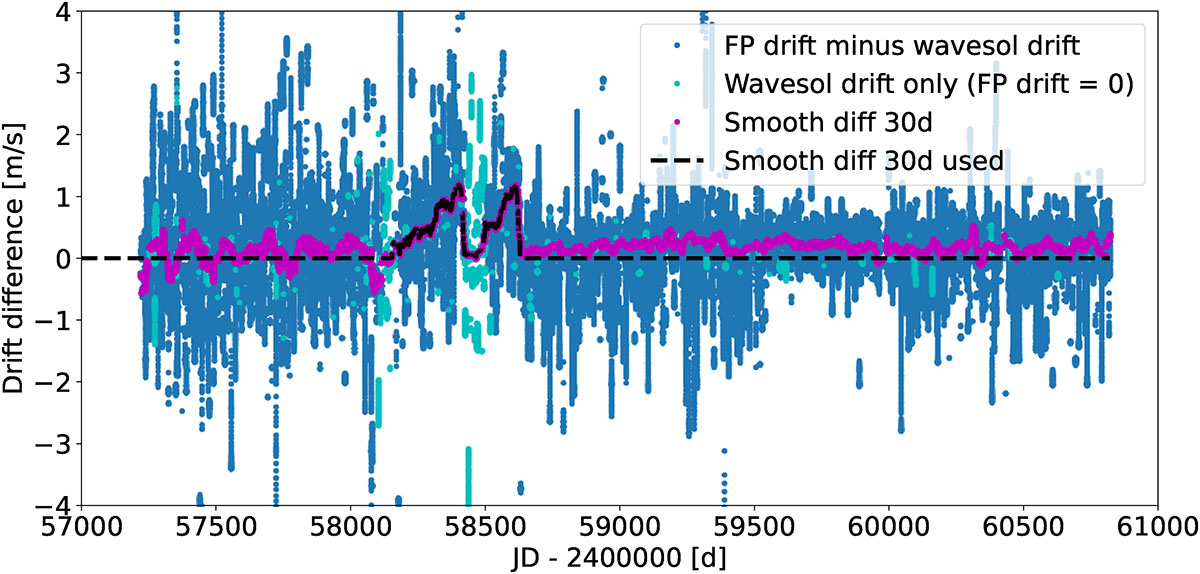
Fig. E.1.
Download original image
Difference in the spectrograph drift measurement between the information provided by simultaneous FP calibrations and a linear interpolation between daily wavelength solutions (dark blue dots). Light blue dots correspond to times when the FP was down, and thus no simultaneous drift measurement was performed. The magenta dots correspond to a 30 day smoothed version of the RV difference and the black dash-line corresponds to our correction model for spurious FP drift measurements (equal to zero when the drift difference is negligible).
Current usage metrics show cumulative count of Article Views (full-text article views including HTML views, PDF and ePub downloads, according to the available data) and Abstracts Views on Vision4Press platform.
Data correspond to usage on the plateform after 2015. The current usage metrics is available 48-96 hours after online publication and is updated daily on week days.
Initial download of the metrics may take a while.