Open Access
Fig. 2.
Download original image
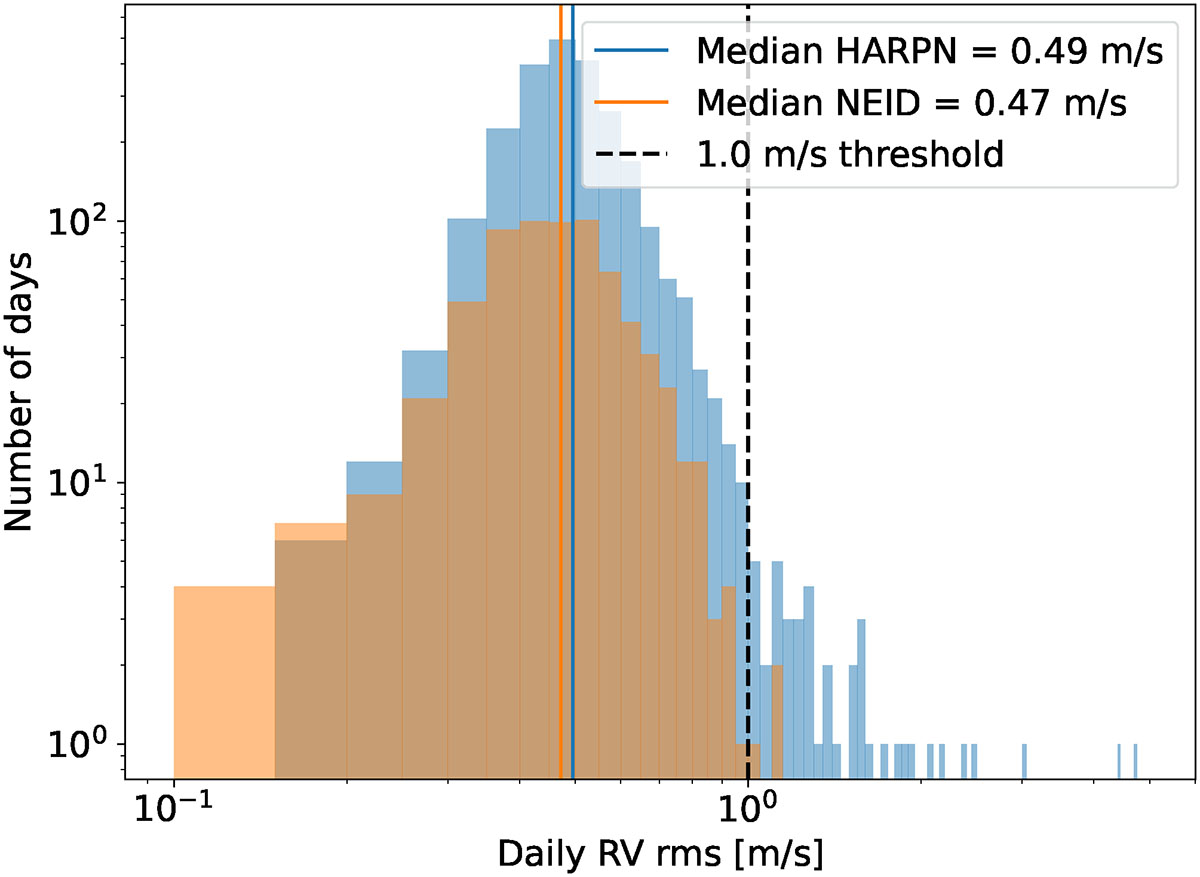
Histogram of the daily RV rms for the HARPS-N solar data presented in this paper compared with the same statistics from the NEID data published in Ford et al. (2024) for comparison. We note that the NEID data correspond to the 5 minute binned NEID solar data.
Current usage metrics show cumulative count of Article Views (full-text article views including HTML views, PDF and ePub downloads, according to the available data) and Abstracts Views on Vision4Press platform.
Data correspond to usage on the plateform after 2015. The current usage metrics is available 48-96 hours after online publication and is updated daily on week days.
Initial download of the metrics may take a while.