Fig. 4.
Download original image
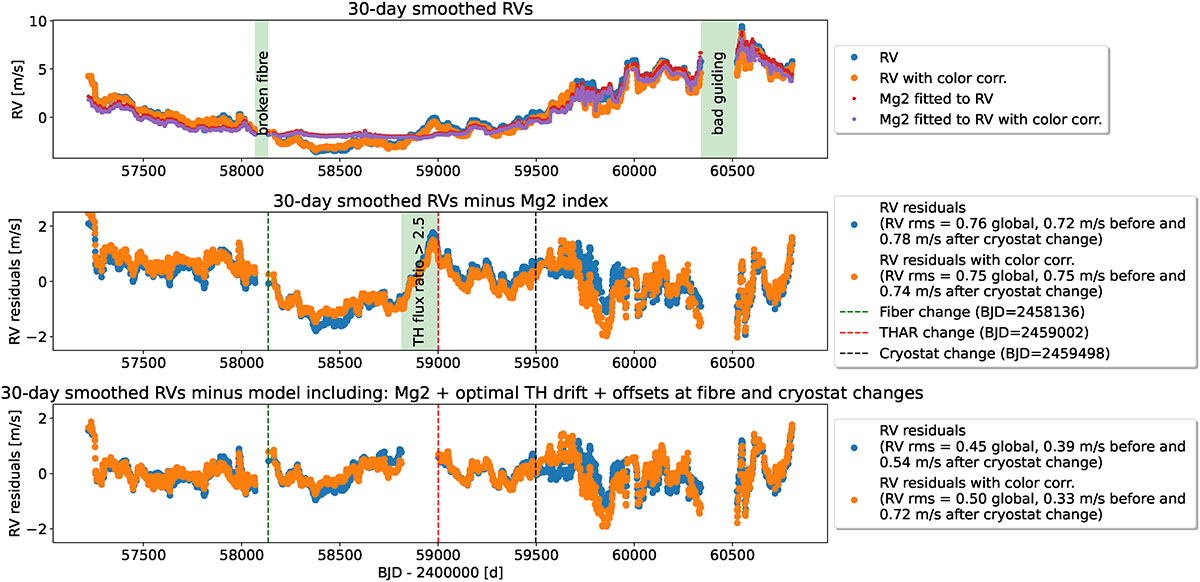
Top: Radial velocities without and with the correction for blaze variation, smoothed using a 30 day moving average to mitigate stellar activity signals due to the Sun’s rotation (in blue and orange, respectively). The red and purple dots corresponds to the best-fitted linear model of the Mg2 activity index to those two different time-series. Middle: Radial velocity residuals after subtracting the best Mg2 activity index linear model. The vertical lines highlight the change of the broken solar feed fibre, the change of the TH-AR HC lamp used for wavelength solution and the change of the detector cryostat (see legend). The green region highlights a period when the flux of the TH-AR HC lamp was larger than 2.5 times it nominal value (see Fig. 1). Bottom: Radial velocity residuals after subtracting a linear model including the Mg2 activity index, two offsets for the broken fibre and the cryostat change and a scaling factor for the AR1 to TH ratio.
Current usage metrics show cumulative count of Article Views (full-text article views including HTML views, PDF and ePub downloads, according to the available data) and Abstracts Views on Vision4Press platform.
Data correspond to usage on the plateform after 2015. The current usage metrics is available 48-96 hours after online publication and is updated daily on week days.
Initial download of the metrics may take a while.