Fig. 6.
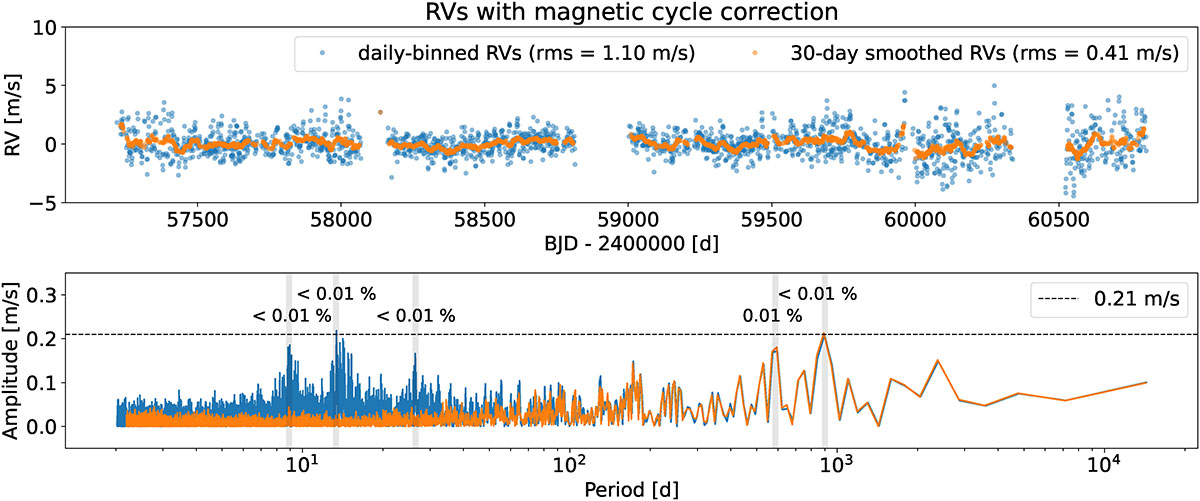
Download original image
Top: Daily binned RVs and 30 day smoothed average once a linear fit to the Mg2 activity index has been removed to mitigate the RV long-term effect induced by the solar magnetic cycle. Bottom: Corresponding Lomb-Scargle periodograms in RV amplitude. As can be seen, the 30 day smoothing absorbs signal up to 150 days and both datasets give the same signals above 150 days. The horizontal dashed line corresponds to the maximum peak for periods longer than 150 days, which is seen at a period 895 days, with an RV amplitude of 0.21 m s−1. The numbers on top of each significant peak, highlighted in grey, correspond to the signal false alarm probabilities.
Current usage metrics show cumulative count of Article Views (full-text article views including HTML views, PDF and ePub downloads, according to the available data) and Abstracts Views on Vision4Press platform.
Data correspond to usage on the plateform after 2015. The current usage metrics is available 48-96 hours after online publication and is updated daily on week days.
Initial download of the metrics may take a while.