Fig. 7.
Download original image
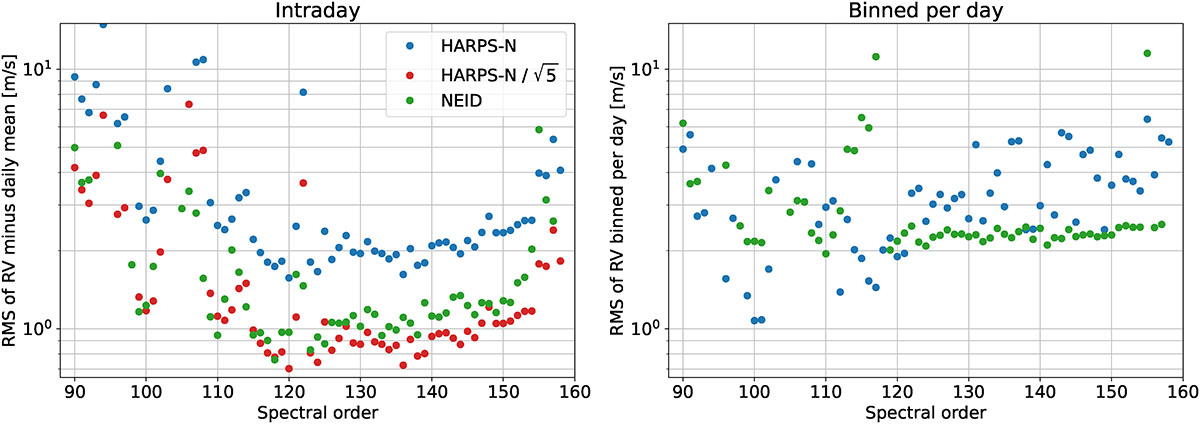
Intraday RV rms on the left and RV rms of data binned per day on the right for each spectral order. Blue dots corresponds to an analysis of the HARPS-N solar data presented in this paper, and green dots to the analysis of the NEID solar data shown in Fig. 5 in Ford et al. (2024) (data courtesy of Eric Ford). The left panel focuses on short-term precision and was obtained by removing from each day of observation its daily mean, and the right panel focuses on long-term precision, dominated by the long-term systematics induced by the solar magnetic cycle. For the intraday analysis (left panel), we should compare the green NEID data with the HARPN red dots labelled HARPN/![]() that corresponds to the blue dots divided by the square root of five. This allowed us to compensate for the S/N difference between HARPS-N (S/N ∼ 300 over 5 minutes) and NEID (5 observations of S/N ∼ 300 over 5 minutes) solar data.
that corresponds to the blue dots divided by the square root of five. This allowed us to compensate for the S/N difference between HARPS-N (S/N ∼ 300 over 5 minutes) and NEID (5 observations of S/N ∼ 300 over 5 minutes) solar data.
Current usage metrics show cumulative count of Article Views (full-text article views including HTML views, PDF and ePub downloads, according to the available data) and Abstracts Views on Vision4Press platform.
Data correspond to usage on the plateform after 2015. The current usage metrics is available 48-96 hours after online publication and is updated daily on week days.
Initial download of the metrics may take a while.