Fig. 8.
Download original image
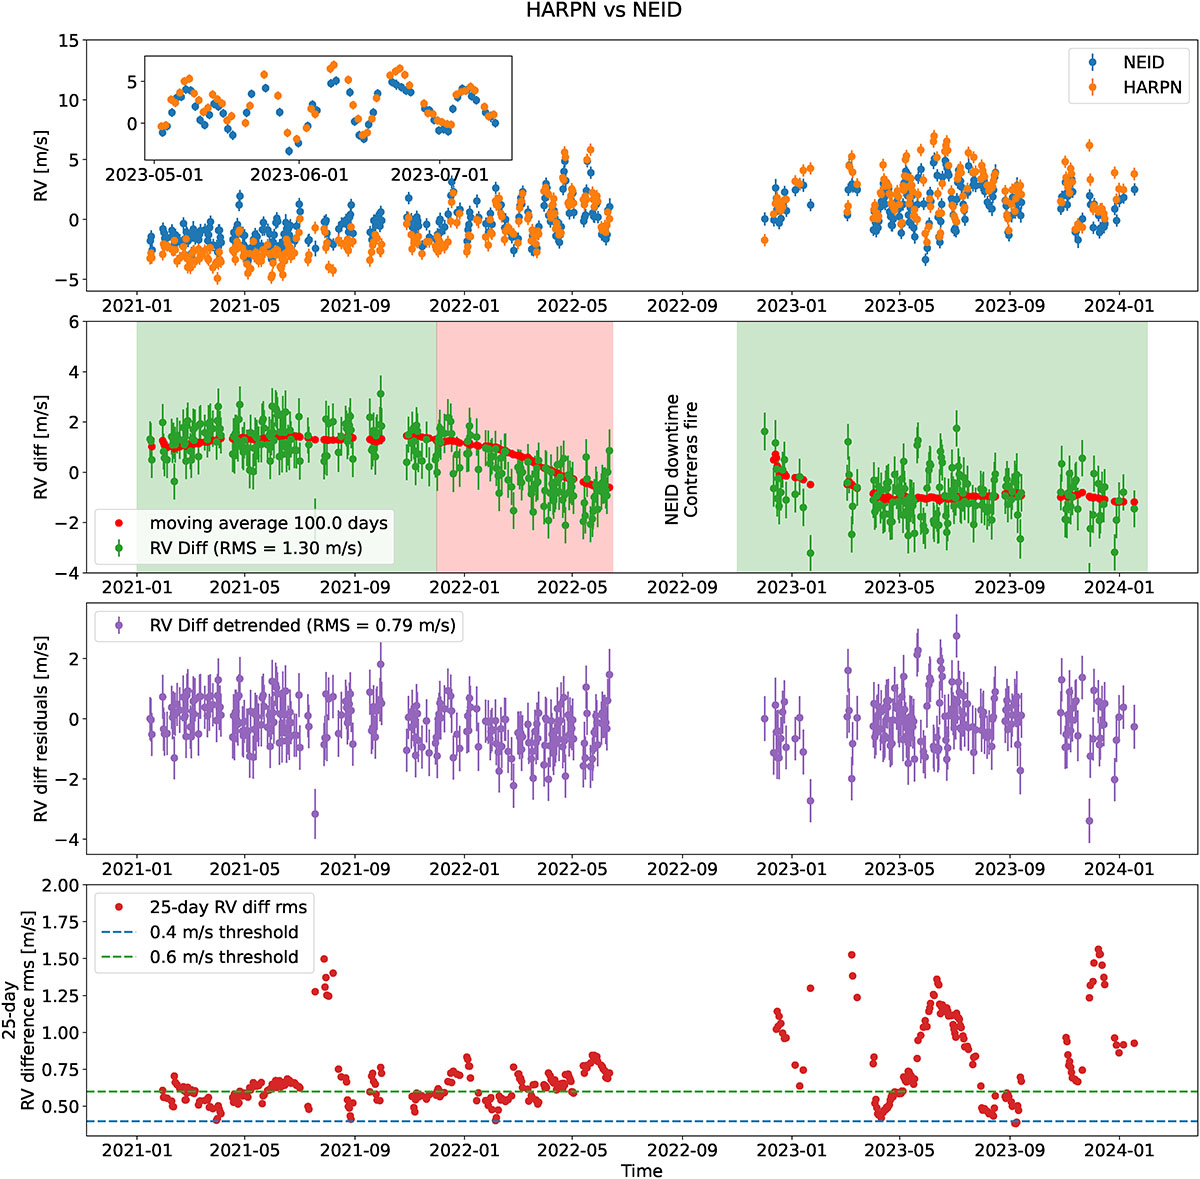
First panel: Comparison between the HARPS-N and NEID solar RVs published in Ford et al. (2024). The inset zooms on two months of the data where rotational modulation from active regions is clearly visible. Second panel: Radial-velocity difference between those two datasets that presents an RV rms of 1.3 m s−1. The red curve corresponds to a moving average with a period of 100 days. Third panel: Radial-velocity difference detrended by the moving average that presents an RV rms of 0.79 m s−1. Fourth panel: Moving standard deviation of the RV difference residuals with a window of 25 days to be sensitive to solar rotation.
Current usage metrics show cumulative count of Article Views (full-text article views including HTML views, PDF and ePub downloads, according to the available data) and Abstracts Views on Vision4Press platform.
Data correspond to usage on the plateform after 2015. The current usage metrics is available 48-96 hours after online publication and is updated daily on week days.
Initial download of the metrics may take a while.