Fig. 3.
Download original image
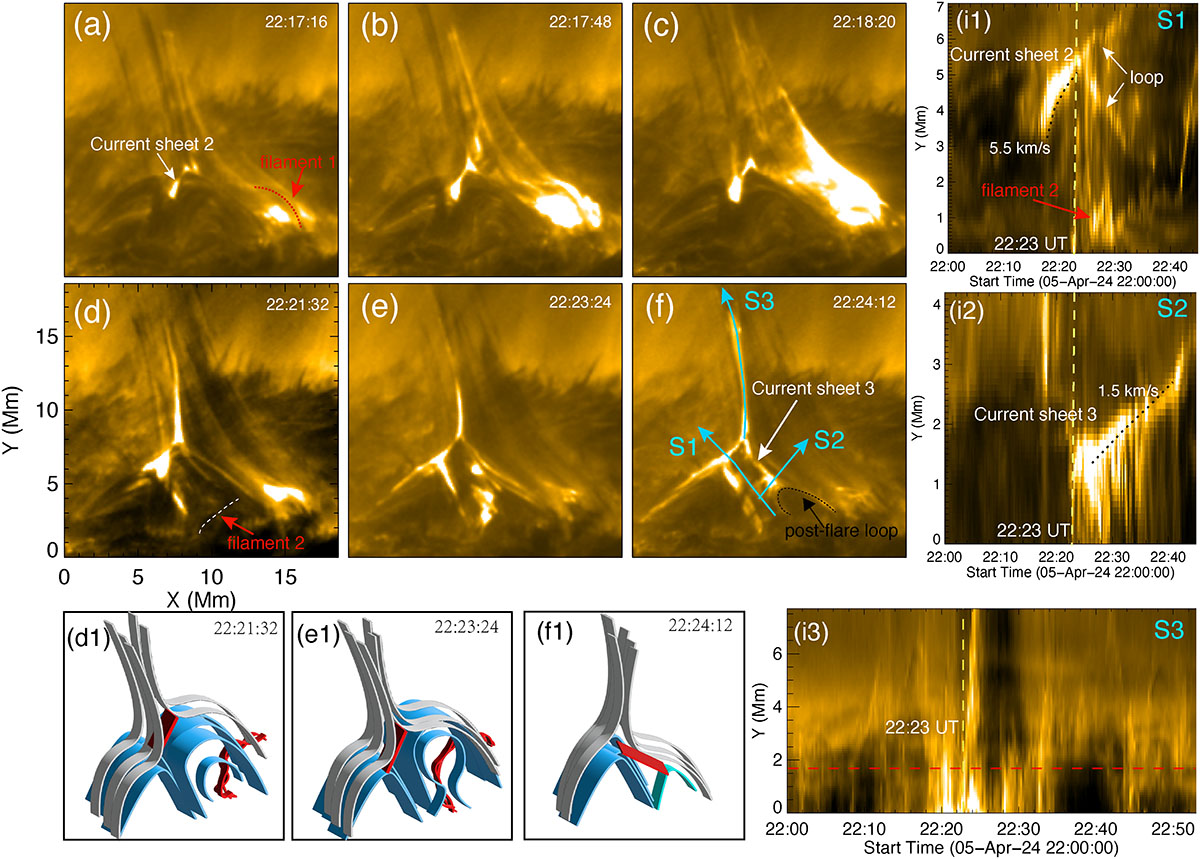
(a)−(f): HRIEUV 174 Å sequence images showing the production of two current sheets. (d1)−(f1): Schematic diagrams of the evolutionary sequence of filament 2, corresponding to the respective time instances shown in panels d−f. (i1)−(i3): Time-distance diagrams along the direction of the cyan arrows in panel f. The dashed black line outlines the post-flare loop after the eruption of filament 2 in panel f. The dashed red line in panel i3 represents the position from which the light curve was extracted for wavelet analysis, with the results presented in Figs. 7a1−7a3.
Current usage metrics show cumulative count of Article Views (full-text article views including HTML views, PDF and ePub downloads, according to the available data) and Abstracts Views on Vision4Press platform.
Data correspond to usage on the plateform after 2015. The current usage metrics is available 48-96 hours after online publication and is updated daily on week days.
Initial download of the metrics may take a while.