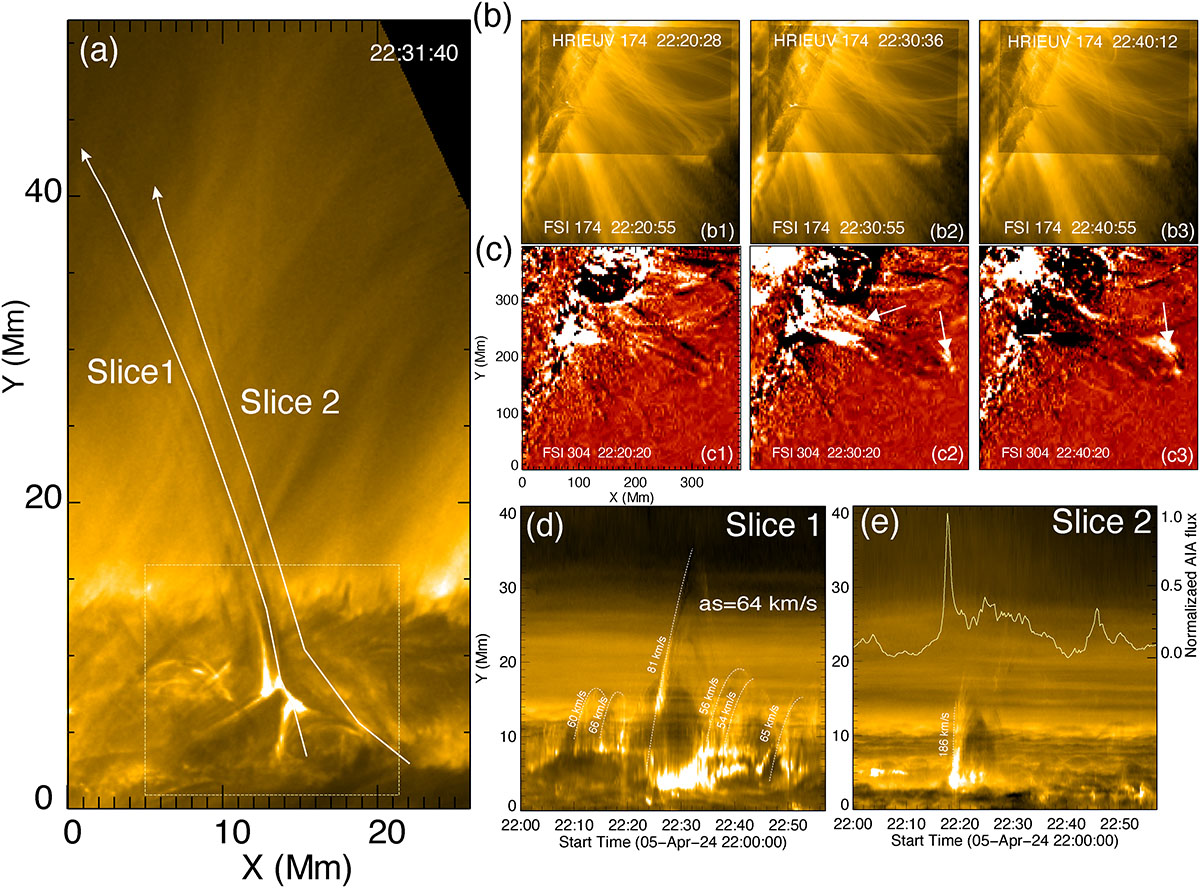
Fig. 6.
Download original image
Panel (a): Direction in which plasma outflow is ejected to its highest position (white arrow, slice 1). Slice 2 is along the direction of the eruption of filament 1 at the side of the fan-spine structure. Panels (b)−(c): HRIEUV images overlaid on the FSI174 images and FSI304 running-difference images, showing the location of the fan-spine-like structure. The white arrows illustrate the plasma ejection material propagating along the closed magnetic field lines in panels (c2)−(c3). Panels (d)−(e): Time−distance intensity diagrams of HRIEUV 174 Å plotted along slices 1 and 2 in panel a. The yellow curve represents the EUI 174 Å light curve, which is calculated within the dashed yellow box in panel a from 22:00 UT to 22:57 UT.
Current usage metrics show cumulative count of Article Views (full-text article views including HTML views, PDF and ePub downloads, according to the available data) and Abstracts Views on Vision4Press platform.
Data correspond to usage on the plateform after 2015. The current usage metrics is available 48-96 hours after online publication and is updated daily on week days.
Initial download of the metrics may take a while.