Fig. 7.
Download original image
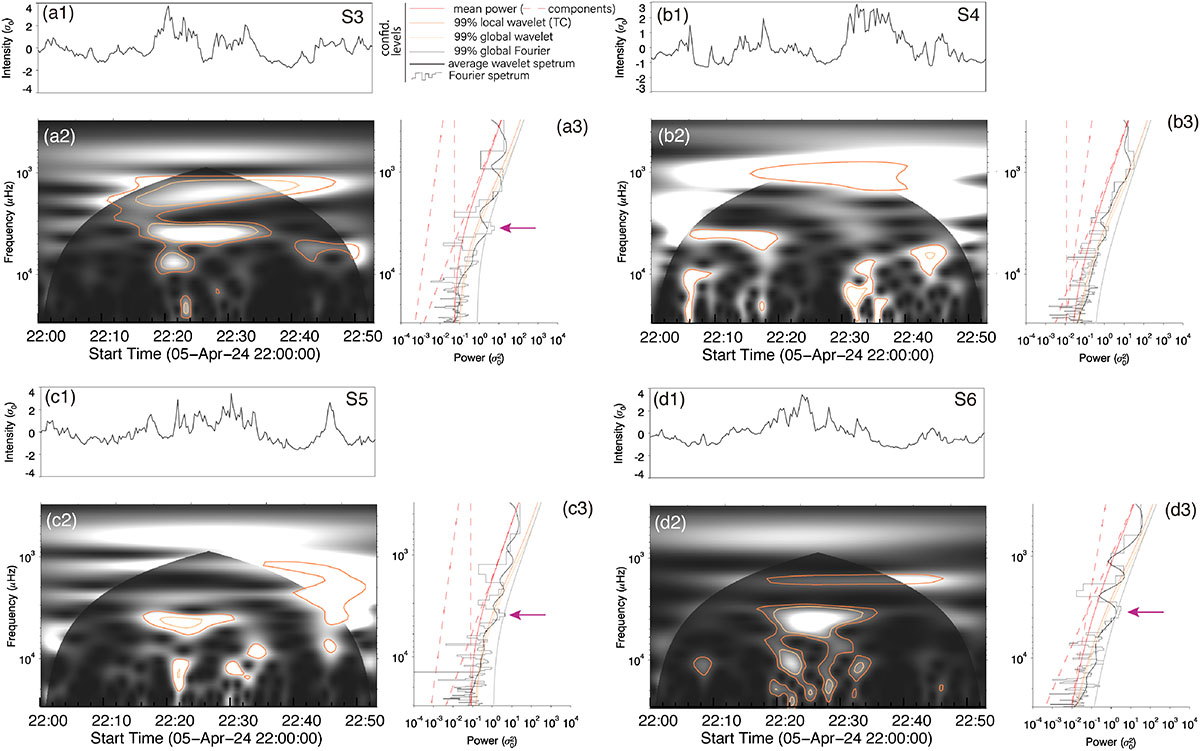
Wavelet and Fourier analysis of the temporal evolution for plasma outflows (Fig. 3i3) and curtain feature (Figs. 4i1–4i3). The variance-normalized light curve is displayed in the upper left corner of each panel. Panels (a2), (b2), (c2), and (d2) illustrate the whitened Morlet wavelet spectrum, which was normalized according to the background power model. The Fourier power spectra (black histogram), time-averaged wavelet spectrum (thick line), and fitted noise model (red line), along with its components (dashed red line), are shown in panels (a3), (b3), (c3), and (d3). The 99% local and global confidence levels with fitted noise are shown as dark and light orange curves, respectively. The gray line indicates the 99% global confidence level for the Fourier spectrum. The peak of the Fourier power is labeled with pink arrows.
Current usage metrics show cumulative count of Article Views (full-text article views including HTML views, PDF and ePub downloads, according to the available data) and Abstracts Views on Vision4Press platform.
Data correspond to usage on the plateform after 2015. The current usage metrics is available 48-96 hours after online publication and is updated daily on week days.
Initial download of the metrics may take a while.