Fig. 3
Download original image
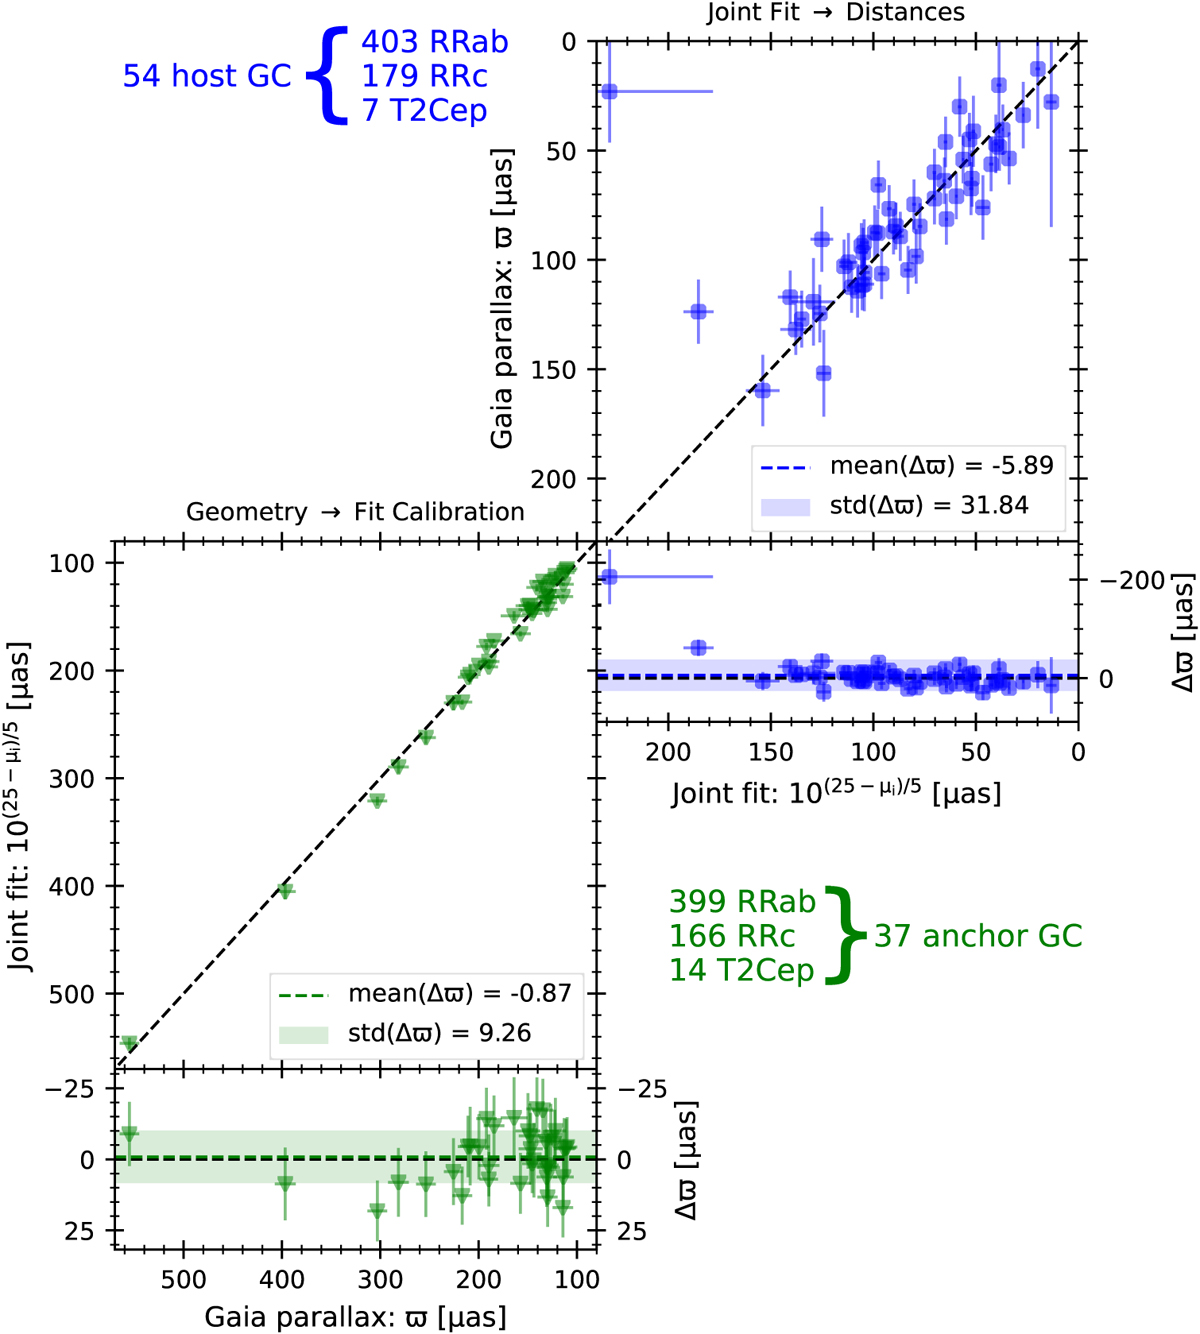
Visualization of the baseline mini-distance ladder. The lower-left panel shows anchor GC parallaxes on the x-axis against the joint-fit distances on the y-axis, including residuals. The mean difference between Gaia parallax and fit parallax for anchor GCs is −0.87 ± 1.52 μ as. The upper-right panel shows the host GC fit distances on the x-axis against the host GC parallaxes on the y-axis, with a mean difference of −5.9 ± 4.3 μ as affected by outliers. The two outlier hosts Terzan 1 and BH 229 are due to sparse membership and do not affect the fit. The comparison reveals no evidence for a distance dependent bias of GDR3 parallaxes.
Current usage metrics show cumulative count of Article Views (full-text article views including HTML views, PDF and ePub downloads, according to the available data) and Abstracts Views on Vision4Press platform.
Data correspond to usage on the plateform after 2015. The current usage metrics is available 48-96 hours after online publication and is updated daily on week days.
Initial download of the metrics may take a while.