Fig. 4
Download original image
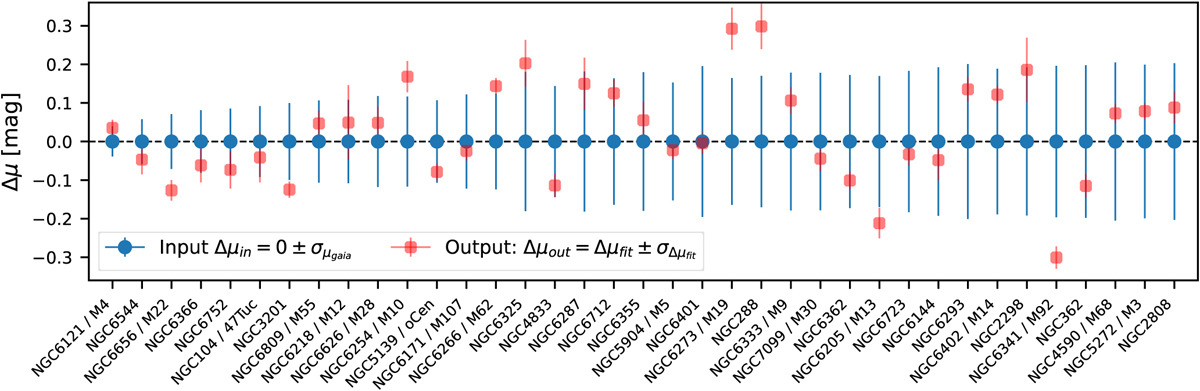
Correction parameters Δ μ for each anchor GC in the baseline. Blue symbols show the initial values (set to zero; Eq. (11)), and red symbols the fitted values (Eq. (A.10)). Clusters are ordered by increasing distance, so the typical uncertainty in Δ μ grows along the x-axis, although the number of member stars also contributes. Overall, 70% of anchors remain within 1σ of their Gaia parallax values, and all lie within 2σ.
Current usage metrics show cumulative count of Article Views (full-text article views including HTML views, PDF and ePub downloads, according to the available data) and Abstracts Views on Vision4Press platform.
Data correspond to usage on the plateform after 2015. The current usage metrics is available 48-96 hours after online publication and is updated daily on week days.
Initial download of the metrics may take a while.