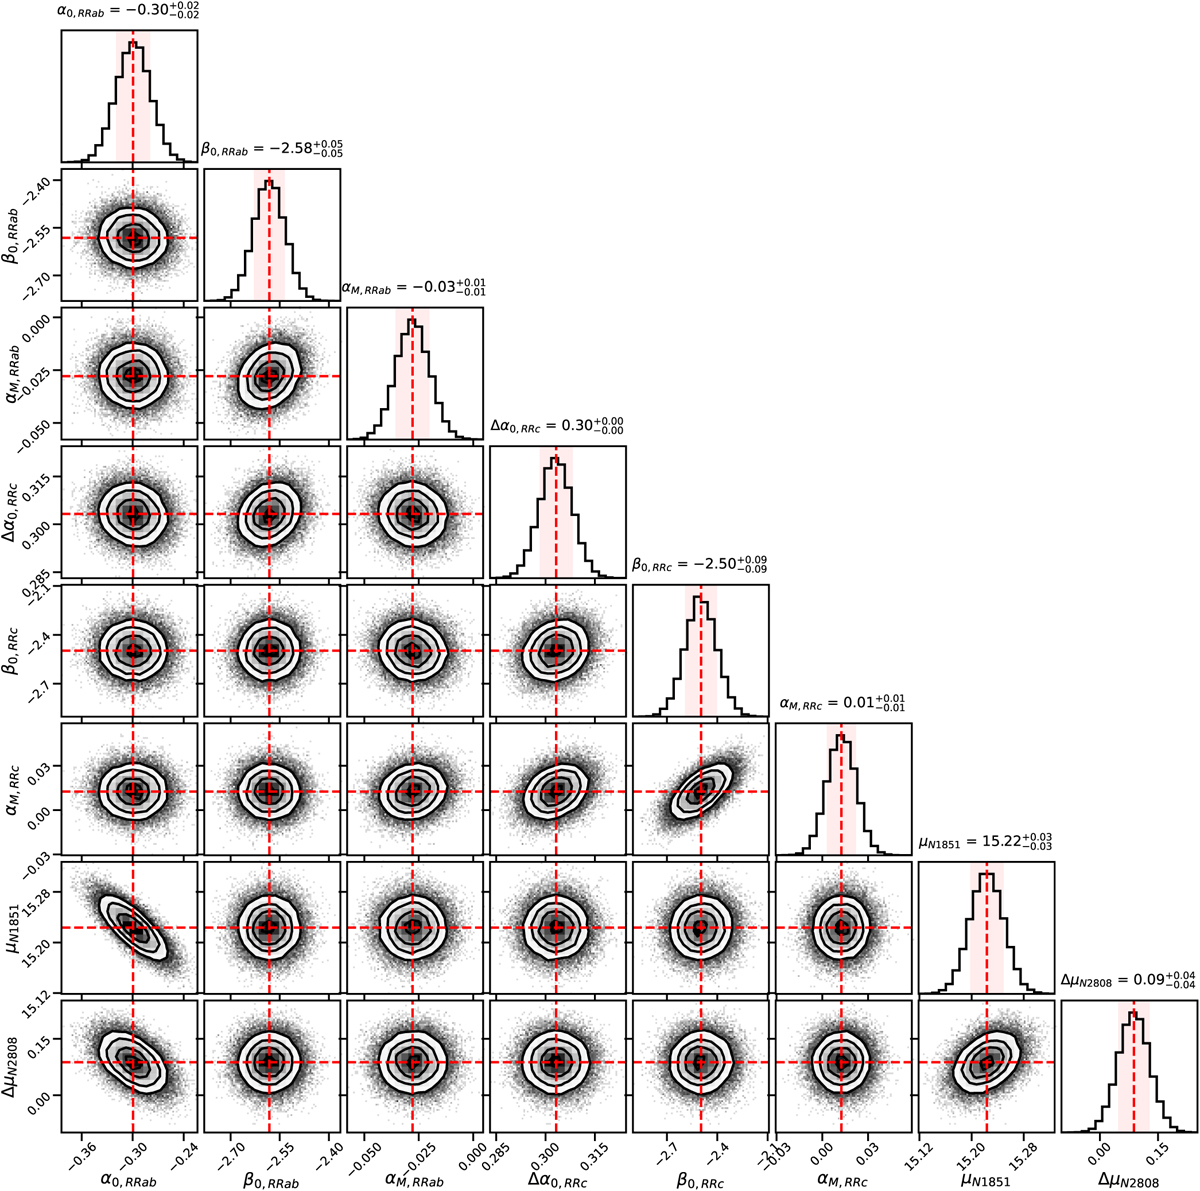
Fig. C.1
Download original image
MCMC sampling of the χ2 statistic for the global fit, showing posterior distributions of selected parameters. Shown are the candle parameters α0, β, and αM for RRab and RRc stars. The corresponding parameters for T2Cep exhibit similar distributions and are omitted here for clarity. The plot also includes one representative host distance and one anchor correction factor. Posterior distributions (black) are well approximated by Gaussians, with means and dispersions closely matching the least-squares solution from the baseline (red). Contours indicate the 1σ, 2σ, and 3σ confidence regions. Correlations between period slopes and metallicity terms are discussed further in Sect. 4.2.2.
Current usage metrics show cumulative count of Article Views (full-text article views including HTML views, PDF and ePub downloads, according to the available data) and Abstracts Views on Vision4Press platform.
Data correspond to usage on the plateform after 2015. The current usage metrics is available 48-96 hours after online publication and is updated daily on week days.
Initial download of the metrics may take a while.