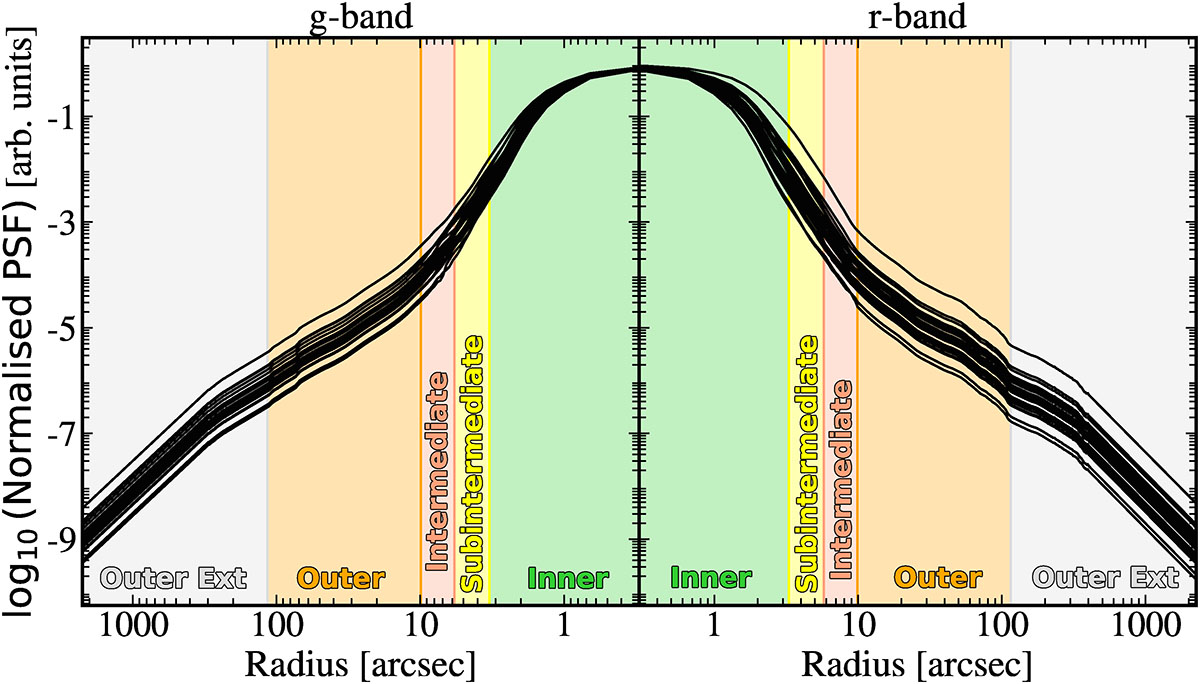
Fig. 1.
Download original image
Normalised radial profile of the PSFs for all fields observed in the g and r bands for the sample galaxies. The PSF total flux is scaled to unity. Vertical shaded regions indicate structural zones defined in the galaxy profile analysis (Inner, Subintermediate, Intermediate, Outer and Outer Ext) (see Sect. 3.3 for details). The y-axis represents normalised intensity in arbitrary units.
Current usage metrics show cumulative count of Article Views (full-text article views including HTML views, PDF and ePub downloads, according to the available data) and Abstracts Views on Vision4Press platform.
Data correspond to usage on the plateform after 2015. The current usage metrics is available 48-96 hours after online publication and is updated daily on week days.
Initial download of the metrics may take a while.