Open Access
Fig. E.2.
Download original image
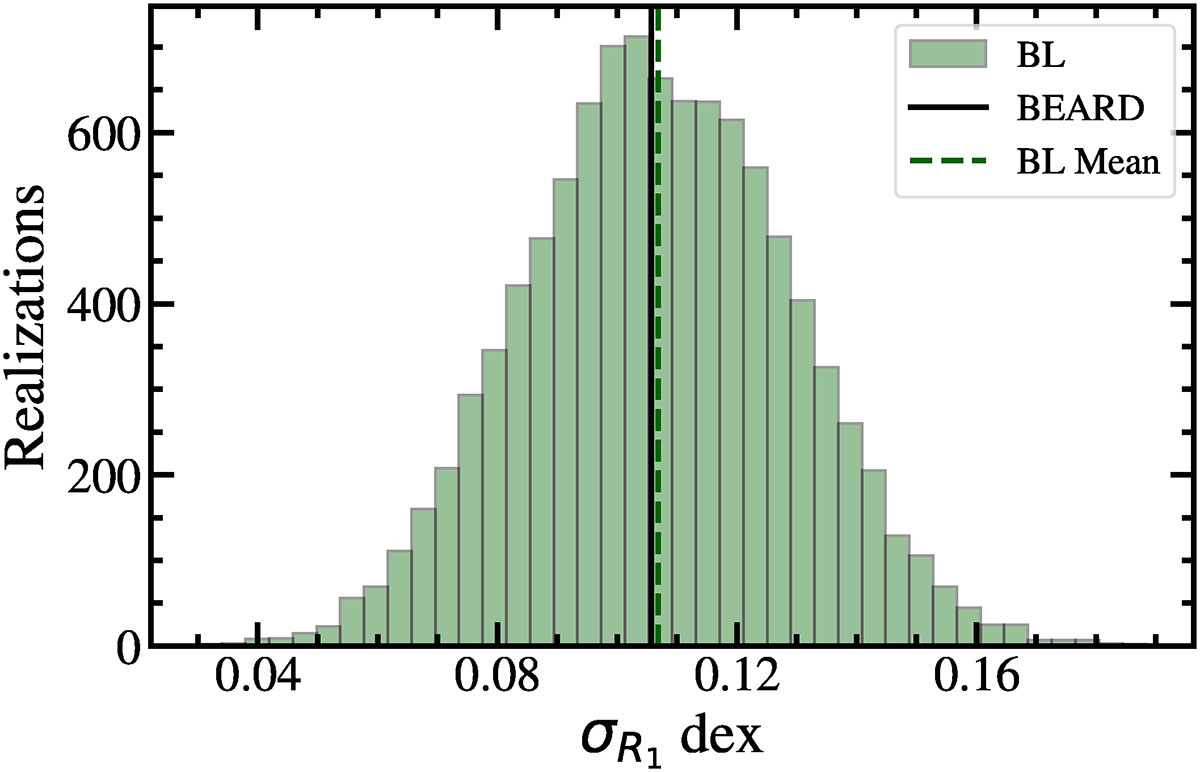
Distribution of scatter in log R1 for 104 random realisations of IllustrisTNG50 BL galaxies in the stellar mass range 10.0 < log(M*/M⊙) < 10.5, each time matching the number of BEARD galaxies in this interval. The vertical solid line shows the BEARD scatter, while the dashed line marks the BL mean.
Current usage metrics show cumulative count of Article Views (full-text article views including HTML views, PDF and ePub downloads, according to the available data) and Abstracts Views on Vision4Press platform.
Data correspond to usage on the plateform after 2015. The current usage metrics is available 48-96 hours after online publication and is updated daily on week days.
Initial download of the metrics may take a while.