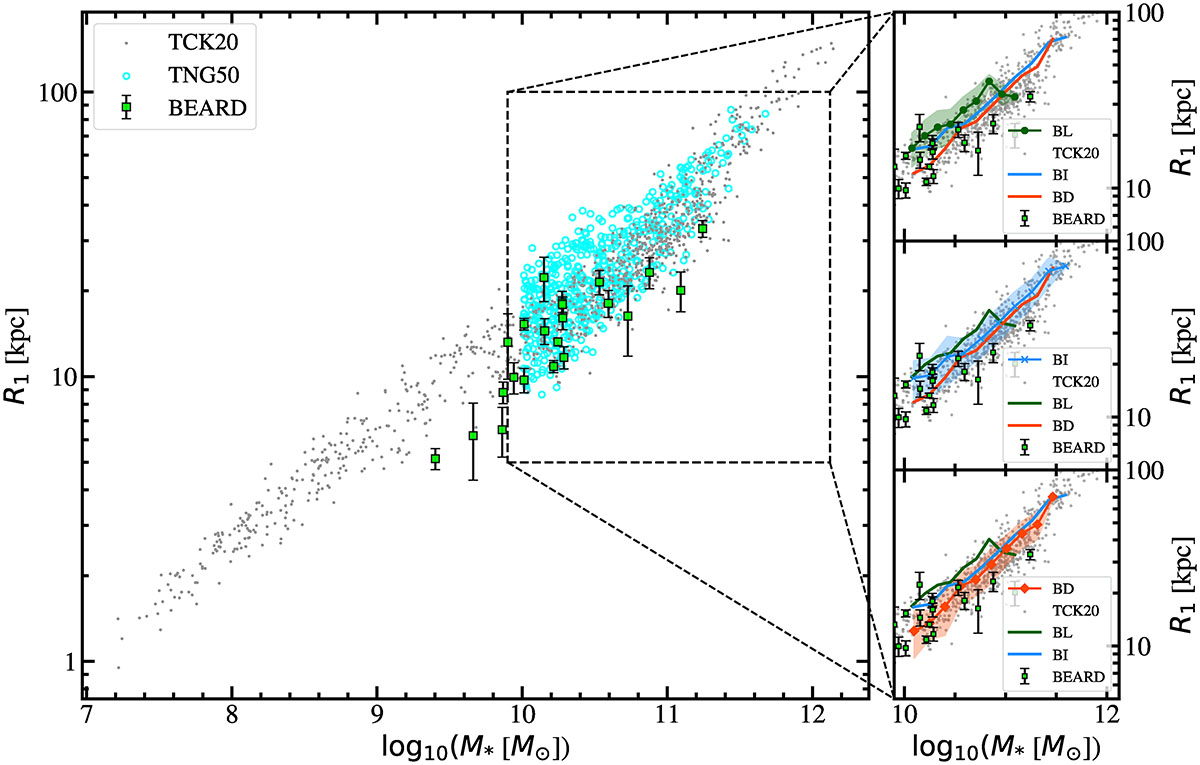
Fig. 3.
Download original image
Stellar mass–size relation defined by the R1 radius. The main panel shows the global distribution of galaxies from different datasets: light-green squares show the BEARD sample of observed galaxies, grey points correspond to the observational sample from Trujillo et al. 2020 (TCK20), and cyan circles represent simulated galaxies from the IllustrisTNG50 run of the IllustrisTNG project (Cardona-Barrero et al. 2025). The right panels separate the IllustrisTNG50 sample into three categories based on their dynamically decomposed bulge-to-disc ratio: BL galaxies in green, BI galaxies in blue, and BD galaxies in orange. To compute the coloured lines for each morphological class, the stellar mass range was divided into 11 equally spaced bins; in each bin, the average R1 value was calculated, and the shaded regions indicate the corresponding standard deviation. For comparison, the TCK20 (grey dots) and BEARD (light-green squares) samples are also shown in each panel.
Current usage metrics show cumulative count of Article Views (full-text article views including HTML views, PDF and ePub downloads, according to the available data) and Abstracts Views on Vision4Press platform.
Data correspond to usage on the plateform after 2015. The current usage metrics is available 48-96 hours after online publication and is updated daily on week days.
Initial download of the metrics may take a while.