Fig. 4.
Download original image
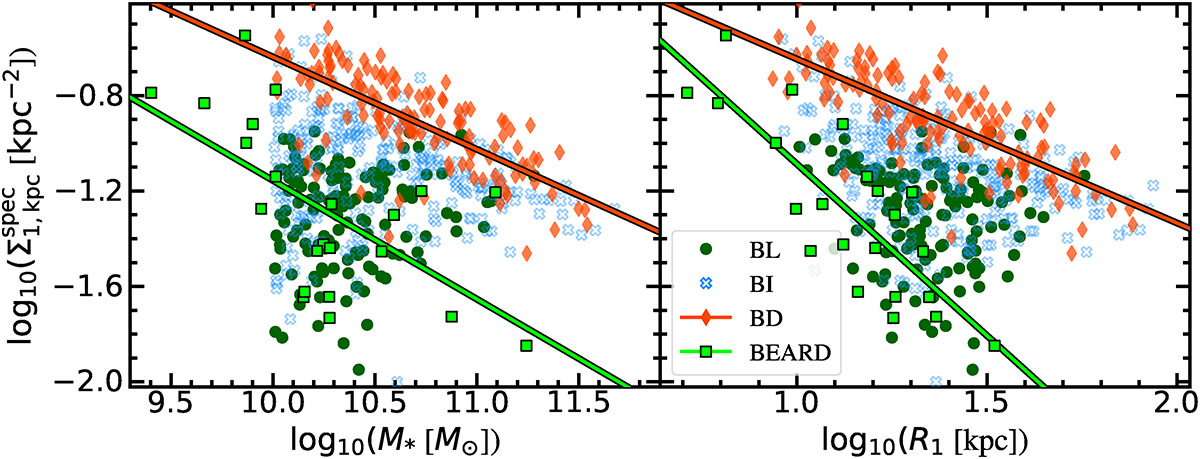
Relation between the specific central mass density ![]() and the global properties of galaxies. Left panel:
and the global properties of galaxies. Left panel: ![]() as a function of stellar mass. Right panel:
as a function of stellar mass. Right panel: ![]() versus R1. In both panels, simulated galaxies from IllustrisTNG50 are colour-coded according to their bulge prominence, with BD galaxies (orange diamonds) occupying the upper regions of the relations, while BL systems (green circles) lie systematically below. BI galaxies (blue crosses) span a wide range in both
versus R1. In both panels, simulated galaxies from IllustrisTNG50 are colour-coded according to their bulge prominence, with BD galaxies (orange diamonds) occupying the upper regions of the relations, while BL systems (green circles) lie systematically below. BI galaxies (blue crosses) span a wide range in both ![]() and size, bridging the two extremes. Observational data from the BEARD sample are shown as light-green squares, consistently occupying the region where BL galaxies are located.
and size, bridging the two extremes. Observational data from the BEARD sample are shown as light-green squares, consistently occupying the region where BL galaxies are located.
Current usage metrics show cumulative count of Article Views (full-text article views including HTML views, PDF and ePub downloads, according to the available data) and Abstracts Views on Vision4Press platform.
Data correspond to usage on the plateform after 2015. The current usage metrics is available 48-96 hours after online publication and is updated daily on week days.
Initial download of the metrics may take a while.