Fig. 1
Download original image
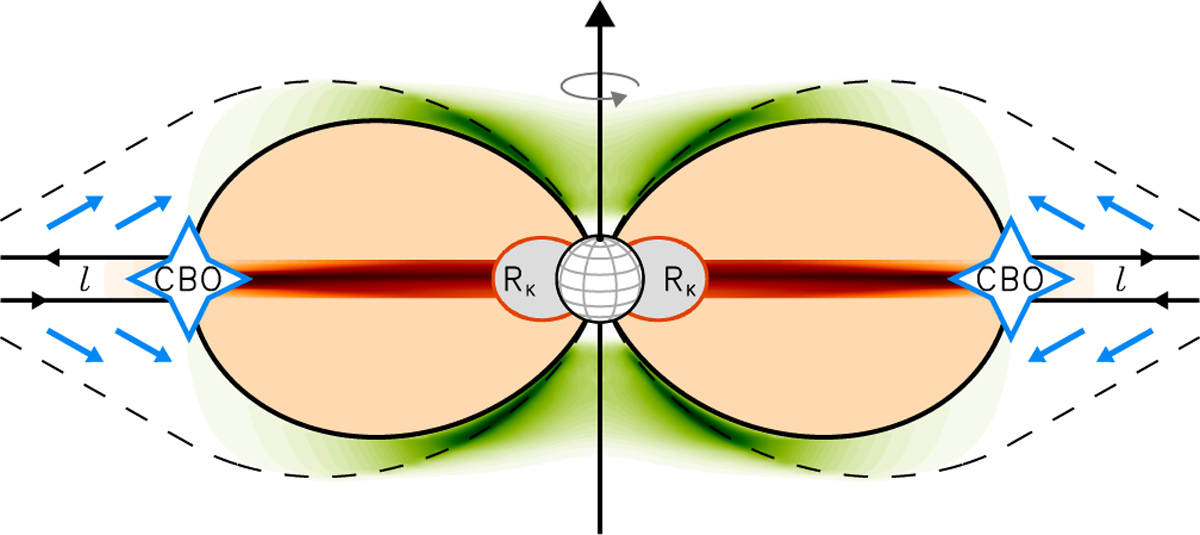
Cartoon summarizing the overall scenario explaining the radio emission originating from the axisymmetric dipole-shaped centrifugal magnetosphere (CM) surrounding a typical fast-rotating BA-type magnetic star (meridian cross-section). The radio emission is a consequence of the centrifugal breakout (CBO) events suffered by the magnetically confined corotating plasma. In stars with CM, the CBO site is located at distances larger than the Keplerian corotation radius (represented by the dipole line crossing the magnetic equator at distance RK). At the distance where the centrifugal force acting on the equatorial plasma disk (pictured by the equatorial shaded red area beyond RK) wins over the magnetic tension, the thermal plasma escapes outward, and the CBOs occur, with the consequent generation of an extended current sheet, where oppositely oriented magnetic field vectors exist in small-scale spatial regions. The reconnection of magnetic fields with opposite polarity is likely to be the acceleration mechanism responsible for isotropically distributed nonthermal electrons. The fraction of relativistic electrons (represented by the thick blue arrows) confined within the magnetic shell, defined by the last closed magnetic field line (marked by the thick black solid line) and the open field line (marked by the dashed solid line) related to the length (l) of the reconnection region, propagates inward along the magnetic field lines toward the poles, radiating in the radio regime via the gyro-synchrotron emission mechanism. This incoherent nonthermal emission mechanism produces a continuum radio spectrum covering a wide spectral range. The green-shaded area represents the corresponding brightness spatial distribution of the radio emission.
Current usage metrics show cumulative count of Article Views (full-text article views including HTML views, PDF and ePub downloads, according to the available data) and Abstracts Views on Vision4Press platform.
Data correspond to usage on the plateform after 2015. The current usage metrics is available 48-96 hours after online publication and is updated daily on week days.
Initial download of the metrics may take a while.