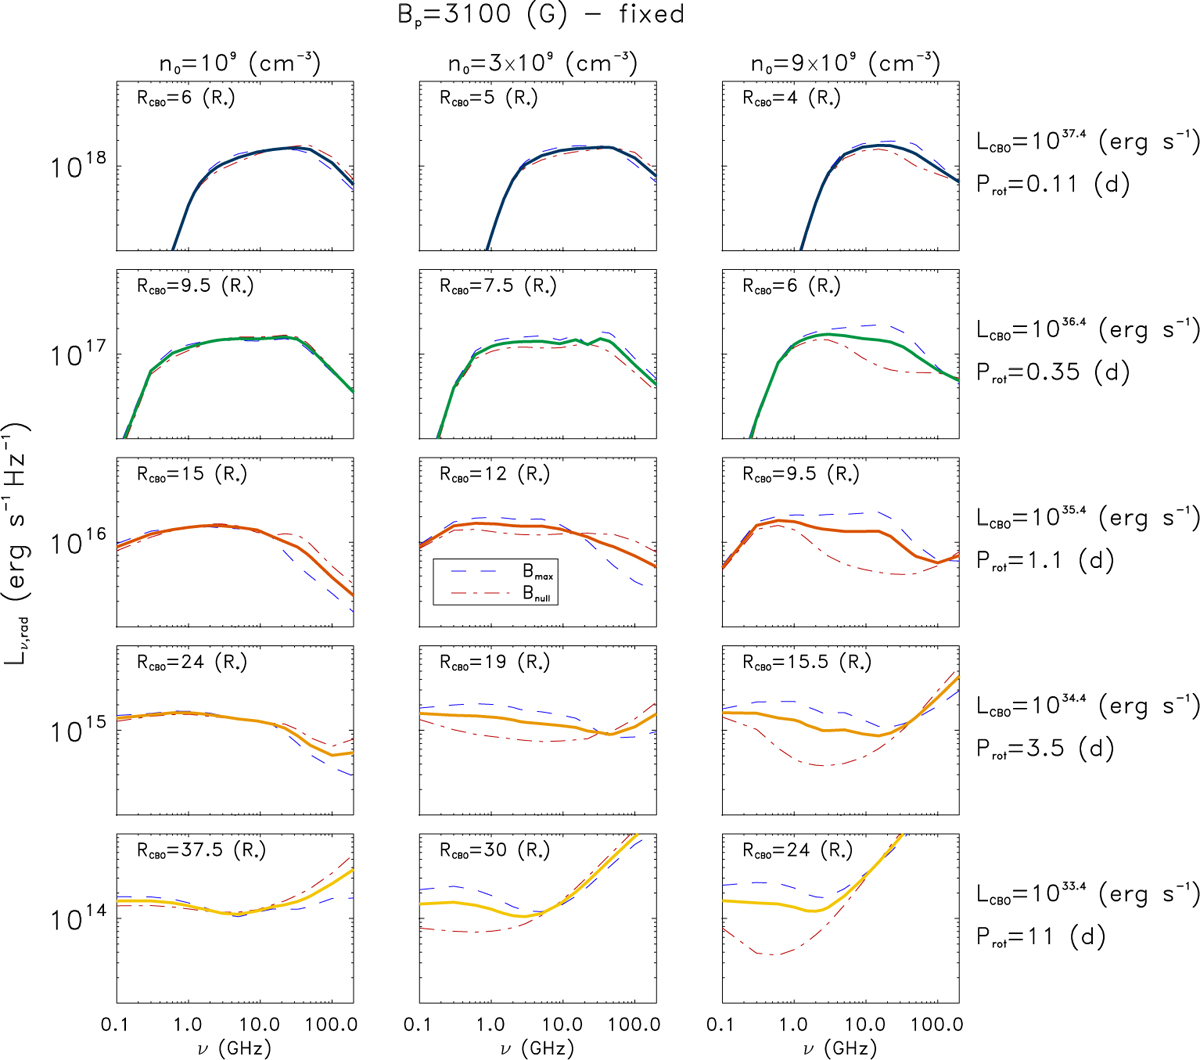
Fig. D.1
Download original image
Simulated spectra calculated taking the magnetic field fixed: Bp = 3100 G, and varying the rotation period (Prot) to cover the range of the CBO powers of the stars displayed in Fig. 4, in accordace with Eq. (2). Blue dashed lines refer to calculations performed at the rotational phase when the magnetic pole is better visible (Bmax). Red dot-dashed lines refer to the calculations performed when the dipole axis is perpendicularly oriented with respect to the line of sight; in this case, the effective magnetic field is null (Bnull). The thick line represents the average spectrum between the two, calculated using the different magnetospheric orientations. The several LCBO analyzed have been marked using the same color code adopted in Fig. 8.
Current usage metrics show cumulative count of Article Views (full-text article views including HTML views, PDF and ePub downloads, according to the available data) and Abstracts Views on Vision4Press platform.
Data correspond to usage on the plateform after 2015. The current usage metrics is available 48-96 hours after online publication and is updated daily on week days.
Initial download of the metrics may take a while.