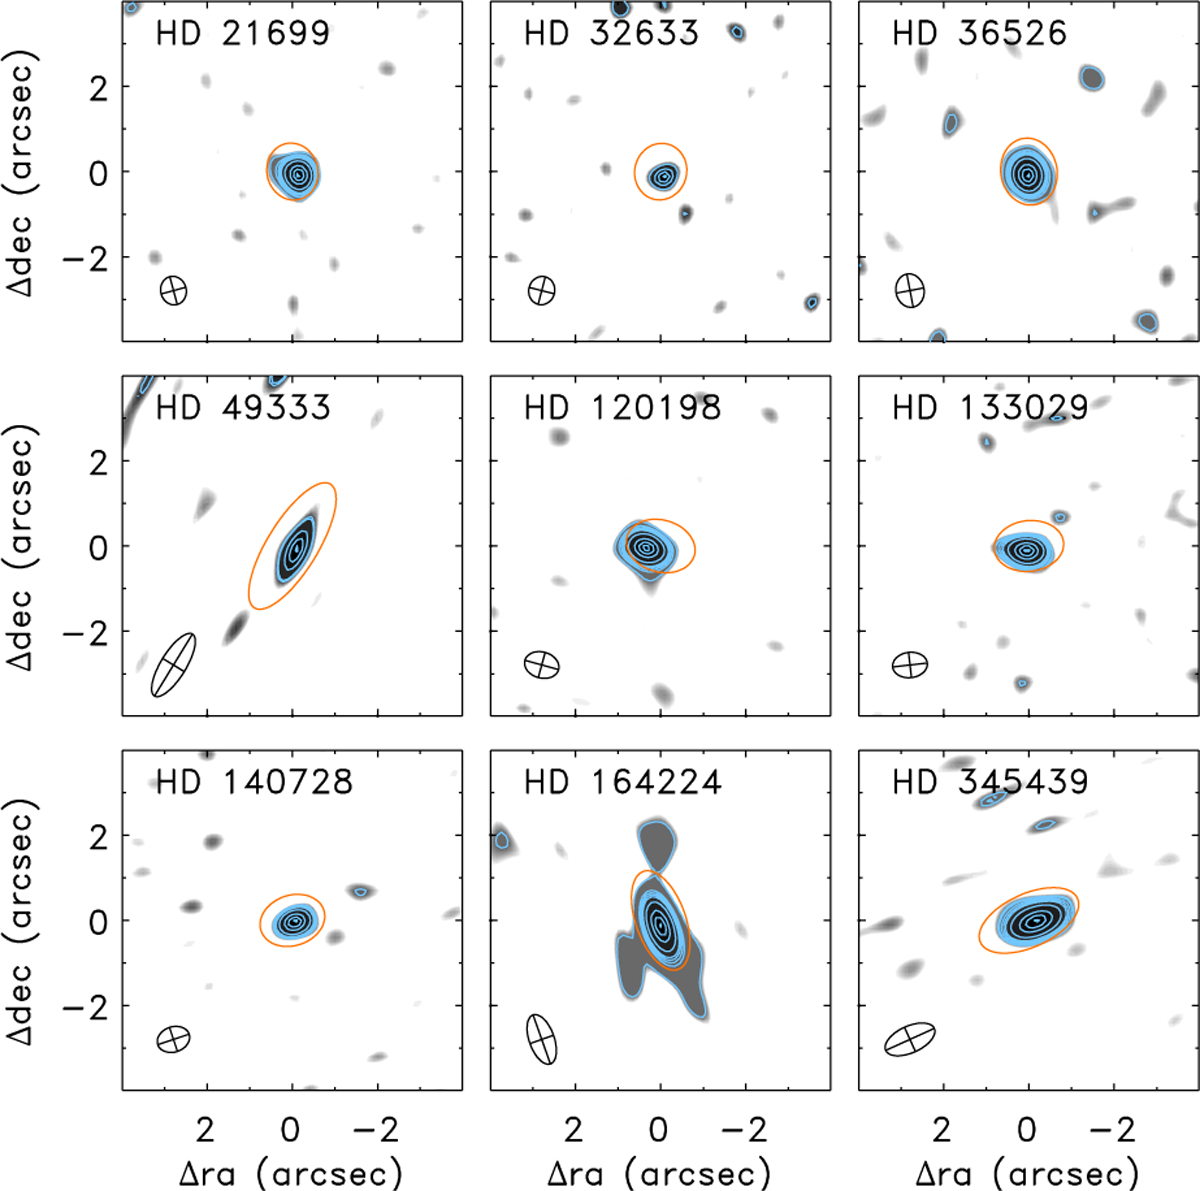
Fig. 2
Download original image
Maps of the nine early-type magnetic stars detected at 9 GHz (see Fig. C.1 for the tentative detected and undetected sources). The maps are centered at the source’s position corrected for the proper motion. Pixels above the 2σ threshold are displayed in gray levels (from the light gray corresponding to the 2σ level up to the black for the brightest pixel of the map). The light-blue contours of each map show the brighter pixels starting from 99% of the source peak going down to the 3σ level. For the brightest sources, all levels spaced in steps of 99%, 90%, 75%, 50%, 35%, 30%, 25%, and 20% from the peak are displayed (all levels are ≥3σ). The red ellipses located at the positions where the stars are expected represent the sky regions covered by the first null beam width (FNBW); this is about twice the half-power beam width (HPBW), displayed in the bottom-left corner.
Current usage metrics show cumulative count of Article Views (full-text article views including HTML views, PDF and ePub downloads, according to the available data) and Abstracts Views on Vision4Press platform.
Data correspond to usage on the plateform after 2015. The current usage metrics is available 48-96 hours after online publication and is updated daily on week days.
Initial download of the metrics may take a while.