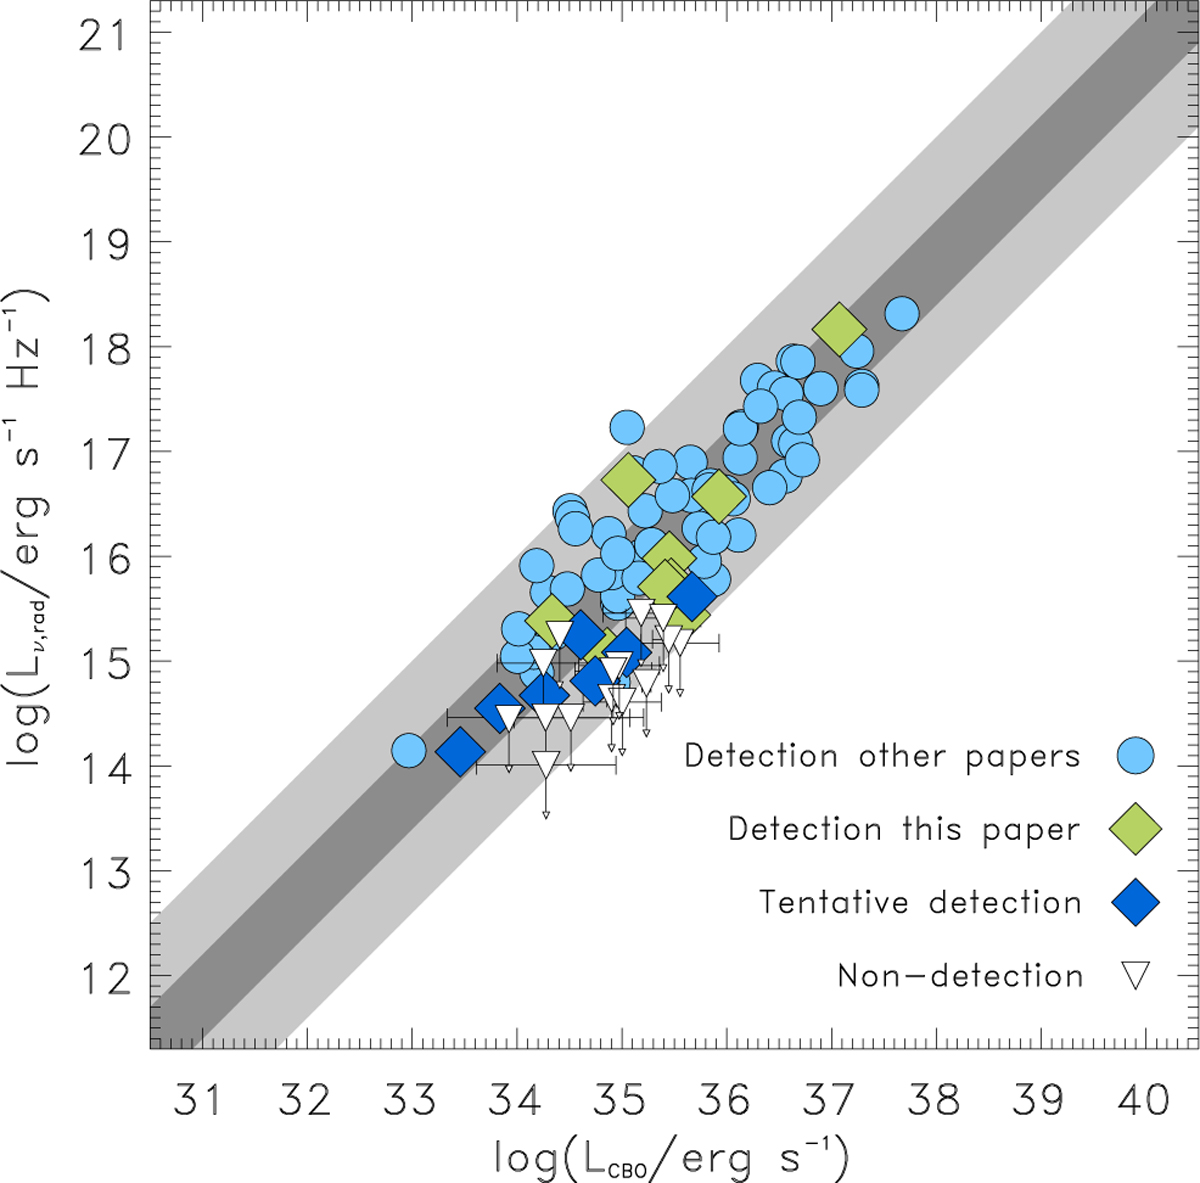
Fig. 4
Download original image
Lν,rad–LCBO diagram. Different symbols are used to distinguish the stars analyzed in this paper from the stars already analyzed in other papers (Leto et al. 2021; Shultz et al. 2022; Das et al. 2025a). The shaded diagonal bands represent the region at 1σ (gray) and 3σ (light-gray) statistical confidence levels obtained by the linear fit of the data. Open downward triangles locate the BA-type magnetic stars not detected by the VLA observations reported in this paper (below the 3σ detection threshold); the downward arrowhead corresponds to the luminosity estimated using the RMS measured on the radio maps (1σ level).
Current usage metrics show cumulative count of Article Views (full-text article views including HTML views, PDF and ePub downloads, according to the available data) and Abstracts Views on Vision4Press platform.
Data correspond to usage on the plateform after 2015. The current usage metrics is available 48-96 hours after online publication and is updated daily on week days.
Initial download of the metrics may take a while.