Fig. 1
Download original image
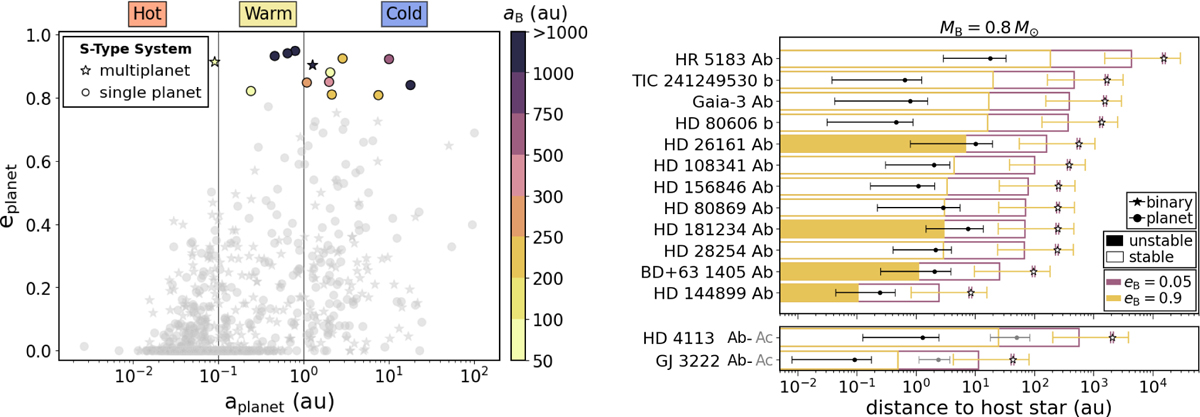
Left: semimajor axis vs. eccentricities of exoplanets in S-type orbits. The circles and stars represent systems with one or multiple planets, respectively. The color bar represents the semimajor axis of the binary star (aB) for planets with eccentricities greater than 0.8. Shaded regions highlight the hot, warm and cold Jupiter populations. The data are from the Encyclopedia of Exoplanets. Right: orbital stability limits for systems with e ≥ 0.8. The effects of a binary stellar companion with MB = 0.8 M⊙ are shown for two eccentricities: eB = 0.05 (purple) and eB = 0.9 (yellow). The stars indicate the observed semimajor axis aB of the binary, while the horizontal lines extend from periapsis qB = aB(1 − eB) to apoapsis QB = aB(1 + eB). Similarly, the horizontal black circles and lines depict the semimajor axis, peri- and apoapsis of the planet, respectively. The purple and yellow bars extend to the critical semimajor axis acrit for the planetary orbit, above which it would not be dynamically stable following Holman & Wiegert (1999), for each binary eccentricity. The filled bars indicate that the system is dynamically unstable under the corresponding binary eccentricity, while the open bars indicate stability.
Current usage metrics show cumulative count of Article Views (full-text article views including HTML views, PDF and ePub downloads, according to the available data) and Abstracts Views on Vision4Press platform.
Data correspond to usage on the plateform after 2015. The current usage metrics is available 48-96 hours after online publication and is updated daily on week days.
Initial download of the metrics may take a while.