Fig. 4
Download original image
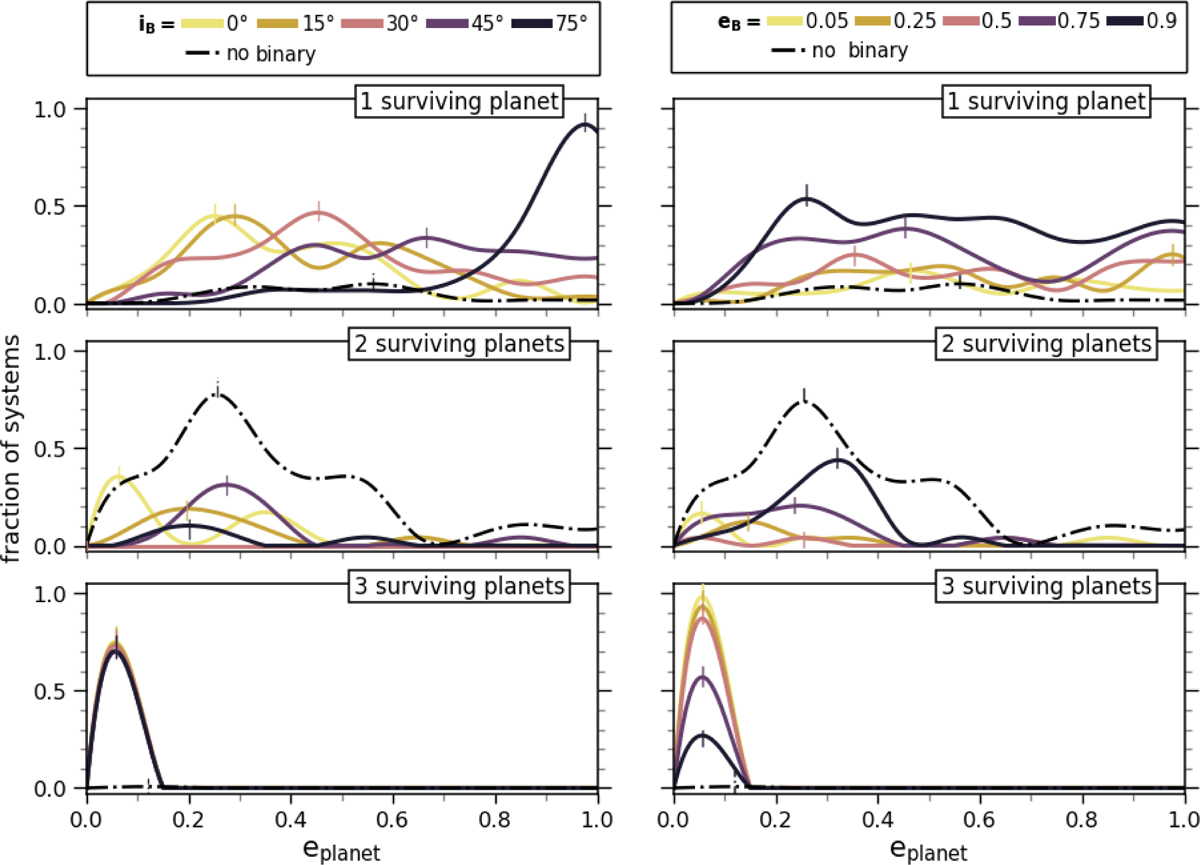
Normalized distribution of planetary eccentricities from simulations of systems with varying binary inclinations (left) and binary eccentricities (right). Each row shows the results for different survival outcomes: one, two, or three remaining planets. The colored curves correspond to individual values of iB or eB, while the black dash-dotted line indicates the reference case without a binary companion.
Current usage metrics show cumulative count of Article Views (full-text article views including HTML views, PDF and ePub downloads, according to the available data) and Abstracts Views on Vision4Press platform.
Data correspond to usage on the plateform after 2015. The current usage metrics is available 48-96 hours after online publication and is updated daily on week days.
Initial download of the metrics may take a while.