Fig. B.1
Download original image
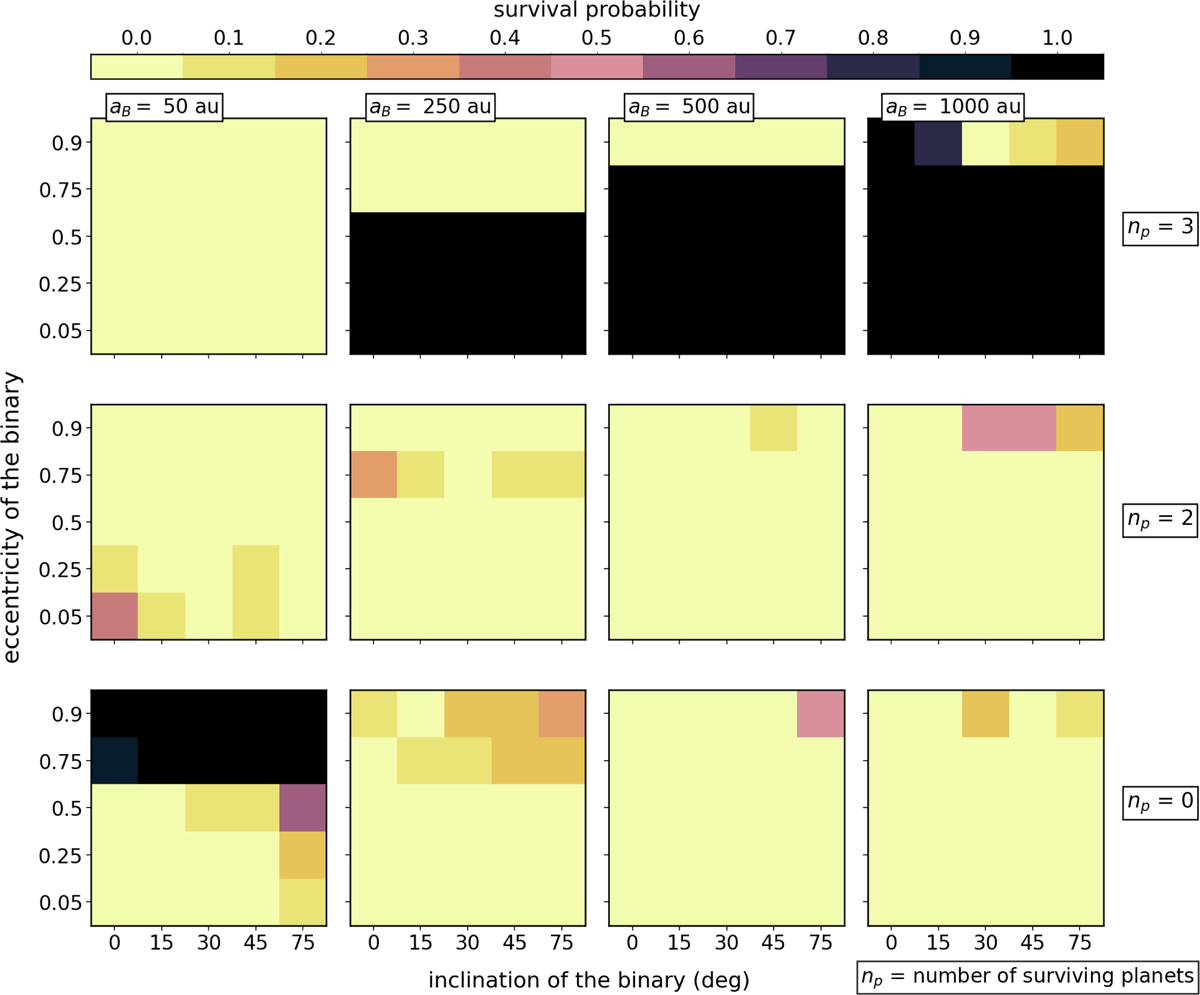
Survival probability distribution for three (top), two (middle), and zero planets (bottom). Only a subset of representative aB values, where the behavior of the system changes significantly, are shown. This figure complements Fig. 2, and illustrates the cases in which more than one planet survives or, conversely, the entire system becomes unstable.
Current usage metrics show cumulative count of Article Views (full-text article views including HTML views, PDF and ePub downloads, according to the available data) and Abstracts Views on Vision4Press platform.
Data correspond to usage on the plateform after 2015. The current usage metrics is available 48-96 hours after online publication and is updated daily on week days.
Initial download of the metrics may take a while.