Fig. 2
Download original image
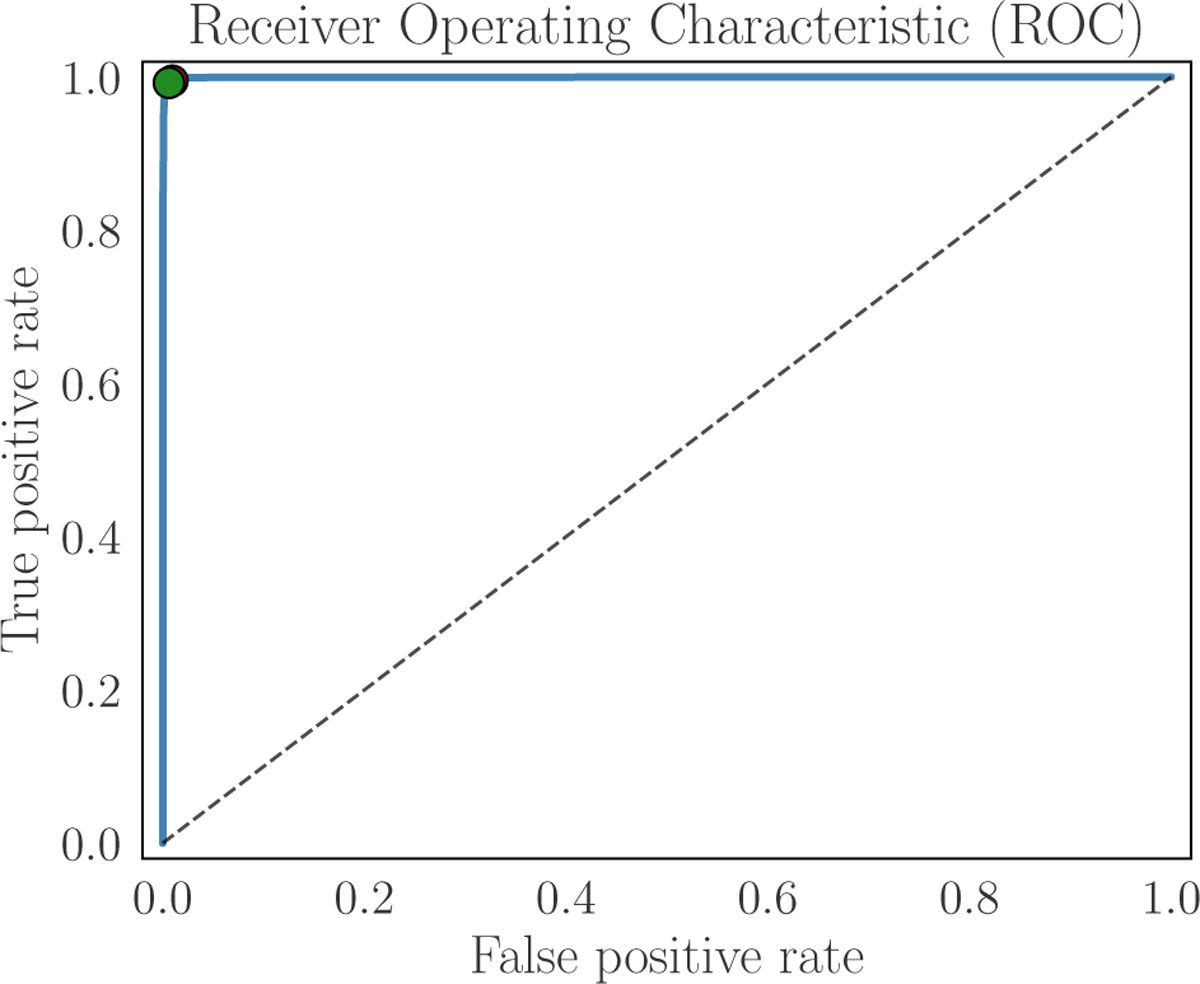
ROC curve showing true positive rate (sensitivity) against the false positive rate (1-specificity). This shows the classifier’s ability to distinguish between single and binary remnant outcomes in stellar collisions. The solid blue curve, with an area under the curve (AUC) of 1.0, represents near-perfect discrimination, approaching the ideal 90-degree elbow shape that would indicate flawless classification. Three critical decision thresholds are marked with colored circles: the default 0.5 threshold (red), the optimal threshold minimising Euclidean distance to perfect classification (green), and Youden’s threshold maximising sensitivity-specificity difference (orange), which coincide due to the classifier’s performance. The black dashed diagonal line represents random guessing (AUC=0.5), serving as a baseline for comparison. The near-vertical ascent of the blue curve followed by a sharp right-angle turn toward the upper left corner reflects the model’s ability to achieve high true positive rates while maintaining minimal false positives, a characteristic of highly discriminative classifiers where clear separation often exists between merger and fly-by outcomes. This performance stems from the physics-informed feature engineering that effectively captures the fundamental differences between these collision regimes.
Current usage metrics show cumulative count of Article Views (full-text article views including HTML views, PDF and ePub downloads, according to the available data) and Abstracts Views on Vision4Press platform.
Data correspond to usage on the plateform after 2015. The current usage metrics is available 48-96 hours after online publication and is updated daily on week days.
Initial download of the metrics may take a while.