Fig. 4
Download original image
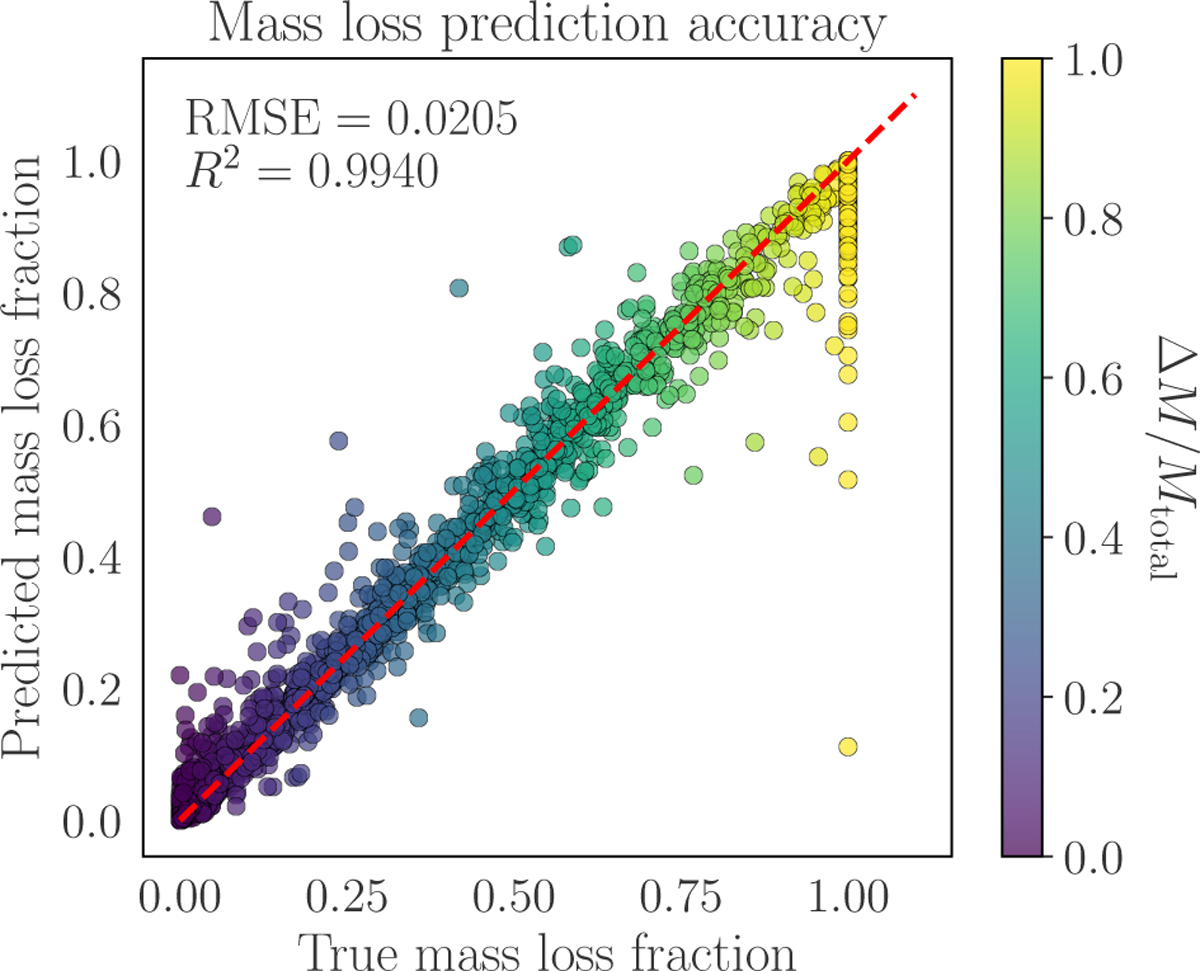
Comparison of predicted against true mass loss fractions (∆M/Mtotal) from stellar collision simulations, with the dashed red line indicating perfect agreement (y = x). Each point represents an individual collision event, colored by relative velocity (darker for higher velocities). The model achieves good accuracy across most of the parameter space, as demonstrated by the tight clustering of points along the diagonal. Deviations emerge primarily in extreme cases (upper right quadrant), where near-total disruption events exhibit underprediction of mass loss. The offset for ∆M/Mtotal ≈ 1.0 reflects the inherent challenge in modelling complete stellar disintegration, where nonlinear hydrodynamic effects dominate. The color gradient illustrates the velocity dependence of prediction errors. These results validate the model’s physical fidelity for all but the most catastrophic encounters.
Current usage metrics show cumulative count of Article Views (full-text article views including HTML views, PDF and ePub downloads, according to the available data) and Abstracts Views on Vision4Press platform.
Data correspond to usage on the plateform after 2015. The current usage metrics is available 48-96 hours after online publication and is updated daily on week days.
Initial download of the metrics may take a while.