Fig. 9
Download original image
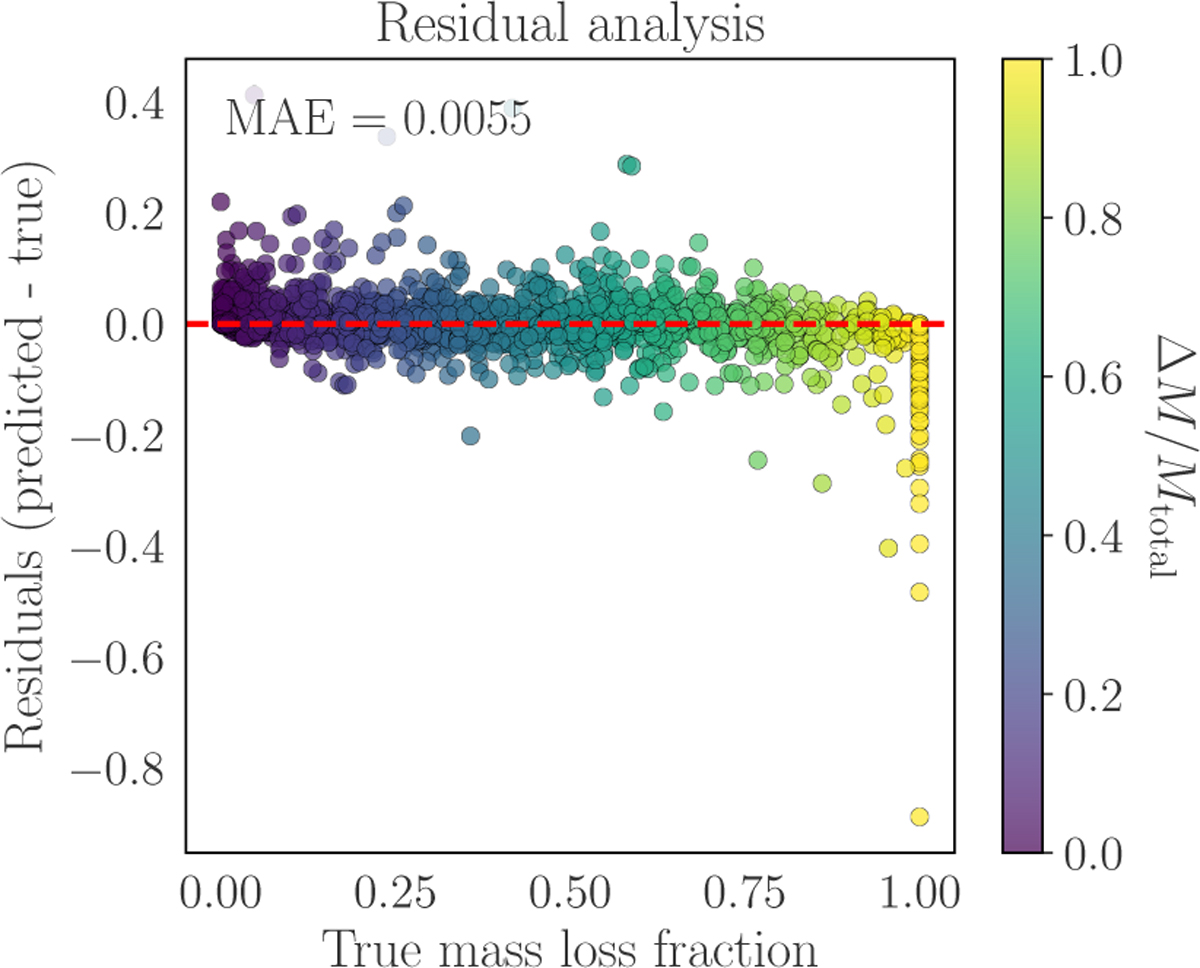
Quantification prediction errors. We show the difference between predicted and true mass loss (y^i - yi) on the vertical axis against the true mass loss fraction (yi) on the horizontal axis. Deviations from the zero-error baseline (y = 0) reveal systematic biases in the model’s predictions: positive residuals indicate regions where the model overpredicts mass loss, typically occurring in high-velocity collisions where relativistic effects become significant but are not fully captured by the feature set, while negative residuals reflect underpredictions, most commonly observed in grazing collisions (b > 0.8) where angular momentum transport is complex. The spread of residuals tightens near yi ≈ 0.25, corresponding to the peak of the training distribution where the model has highest confidence, whereas increased scatter at extreme mass loss values highlights regimes where either training data are sparse or physics terms are incomplete. The MAE of 0.0052, calculated across all residuals, confirms high overall fidelity but masks these localised discrepancies that guide future model refinements.
Current usage metrics show cumulative count of Article Views (full-text article views including HTML views, PDF and ePub downloads, according to the available data) and Abstracts Views on Vision4Press platform.
Data correspond to usage on the plateform after 2015. The current usage metrics is available 48-96 hours after online publication and is updated daily on week days.
Initial download of the metrics may take a while.