Fig. 10.
Download original image
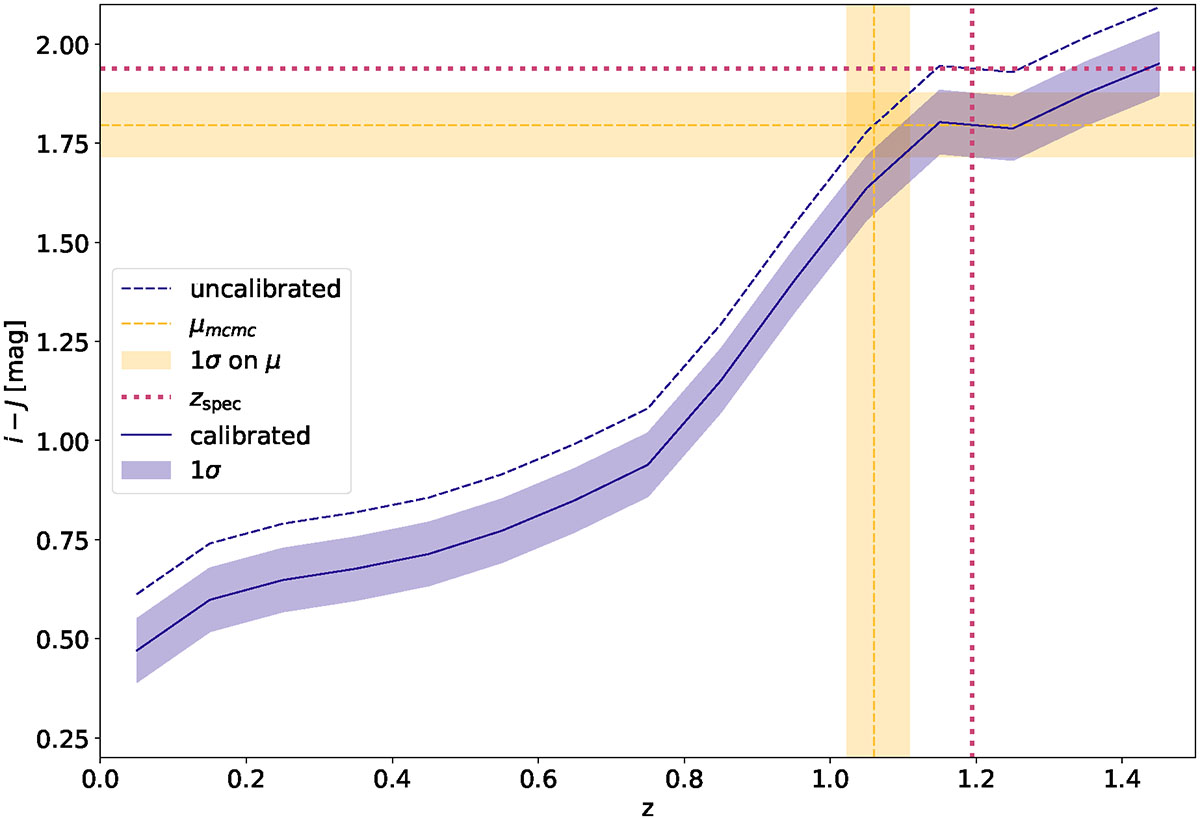
Uncalibrated (dashed blue), as well as calibrated (continuous blue) red-sequence model for the colour index i − J. The blue shaded region shows the offset uncertainty due to the uncertainty on the retrieved mean colour value μ (yellow dashed line and shaded region) for MOO J0319−0025. The dotted magenta line shows the spectroscopic redshift from Gonzalez et al. (2019, vertical) and the corresponding i − J colour (horizontal).
Current usage metrics show cumulative count of Article Views (full-text article views including HTML views, PDF and ePub downloads, according to the available data) and Abstracts Views on Vision4Press platform.
Data correspond to usage on the plateform after 2015. The current usage metrics is available 48-96 hours after online publication and is updated daily on week days.
Initial download of the metrics may take a while.