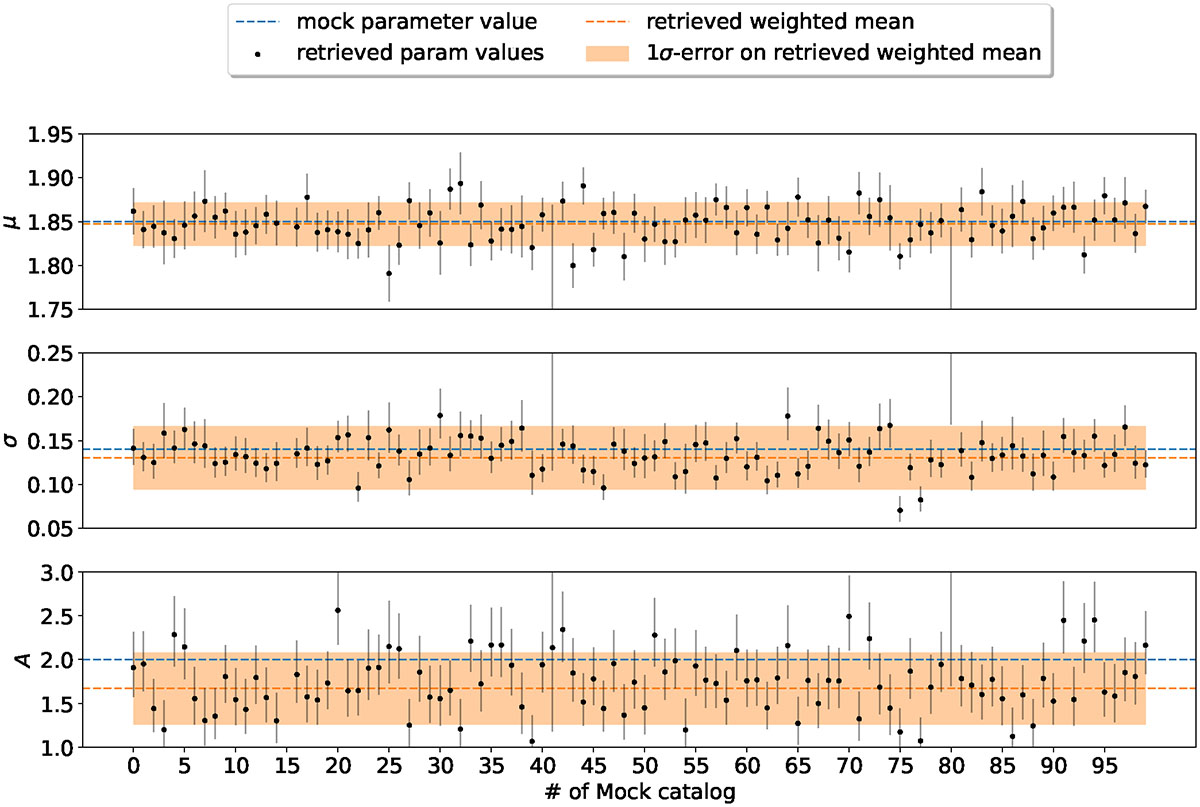
Fig. B.1.
Download original image
Retrieved parameter values for mean excess colour (top), its standard deviation (middle), and amplitude (bottom), as defined in Sect.3.1 over 100 mock realizations. The blue dashed line shows the respective input mock parameter values. The black dots show the individual retrieved parameter values and their uncertainty (68% interval around the maximum likelihood value). The orange dashed line shows the mean parameter values of all 100 mock realizations, weighted by their respective uncertainty. The orange shaded region shows the 1σ error on the weighted mean parameter values as computed in Eq. (B.2)
Current usage metrics show cumulative count of Article Views (full-text article views including HTML views, PDF and ePub downloads, according to the available data) and Abstracts Views on Vision4Press platform.
Data correspond to usage on the plateform after 2015. The current usage metrics is available 48-96 hours after online publication and is updated daily on week days.
Initial download of the metrics may take a while.