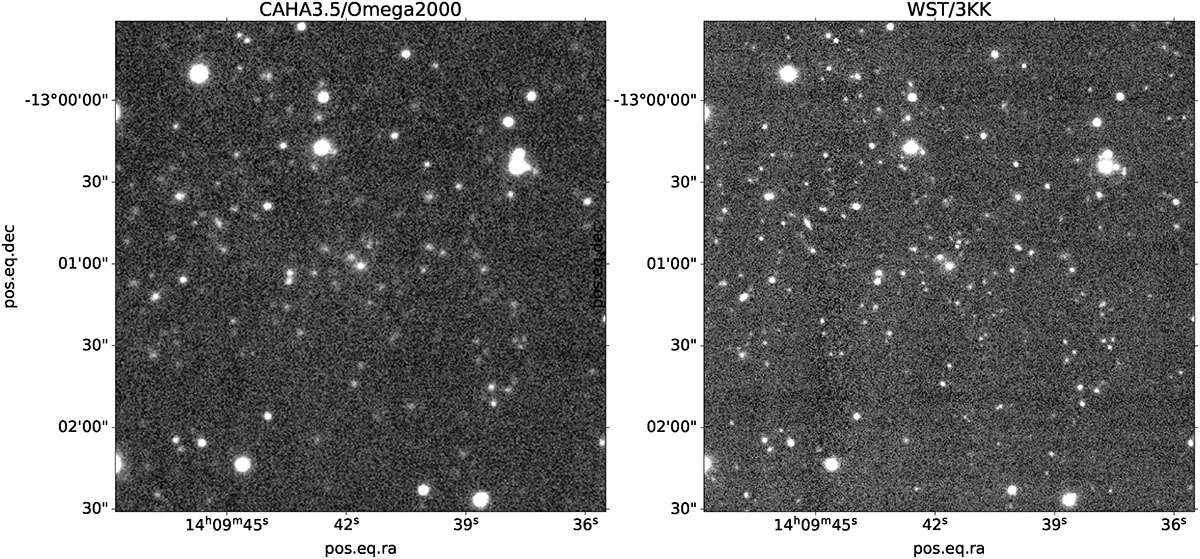
Fig. C.1.
Download original image
Direct comparison of the J-band imaging data obtained using the CAHA3.5/Omega2000 and the WST/3KK instruments. Note the clearer signal of the faint sources close to the centre, as well as the better seeing when comparing the stellar sources. For a quantitative comparison of the imaging data, please see Table D.2. One should consider the fact that this target had the worst image quality in all the CAHA run, and the best in the WST run.
Current usage metrics show cumulative count of Article Views (full-text article views including HTML views, PDF and ePub downloads, according to the available data) and Abstracts Views on Vision4Press platform.
Data correspond to usage on the plateform after 2015. The current usage metrics is available 48-96 hours after online publication and is updated daily on week days.
Initial download of the metrics may take a while.