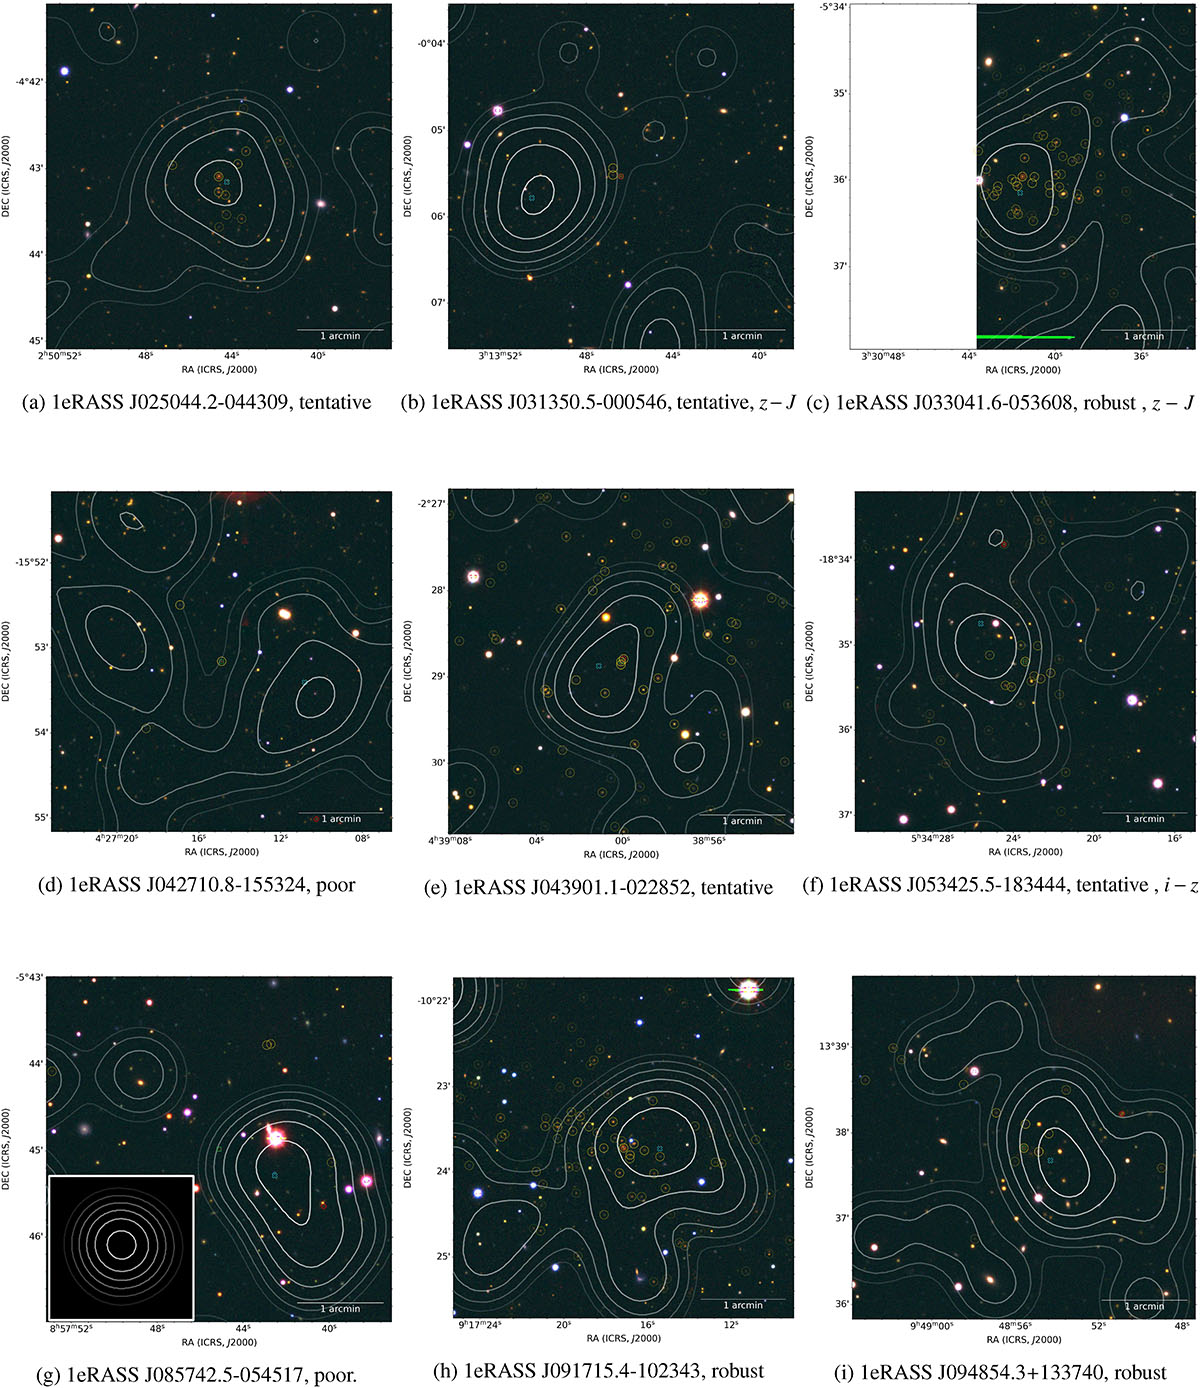
Fig. D.1.
Download original image
Fake rgb images (channels: r:J, g:z, b:g; J-band from CAHA/Omega2000, z- and g-band from the Legacy Survey) of the selected galaxy cluster candidates. We show the optical centre retrieved by Kluge et al. (2024, green square), the X-ray centre (cyan cross), and a BCG candidate found in Kluge et al. (2024, red octagon). The transparency of the yellow circles shows the found cluster member probability (the more transparent, the less probable) in i − J, unless stated otherwise in the caption. We also include the classification of the candidate introduced in Sect. 4.3 in the caption. In the bottom left corner of panel (g) we show the PSF of eROSITA, smoothed consistently with a Gaussian of σ = 12″ (Compare with Fig. 4 of Bulbul et al. 2024).
Current usage metrics show cumulative count of Article Views (full-text article views including HTML views, PDF and ePub downloads, according to the available data) and Abstracts Views on Vision4Press platform.
Data correspond to usage on the plateform after 2015. The current usage metrics is available 48-96 hours after online publication and is updated daily on week days.
Initial download of the metrics may take a while.