Fig. 5.
Download original image
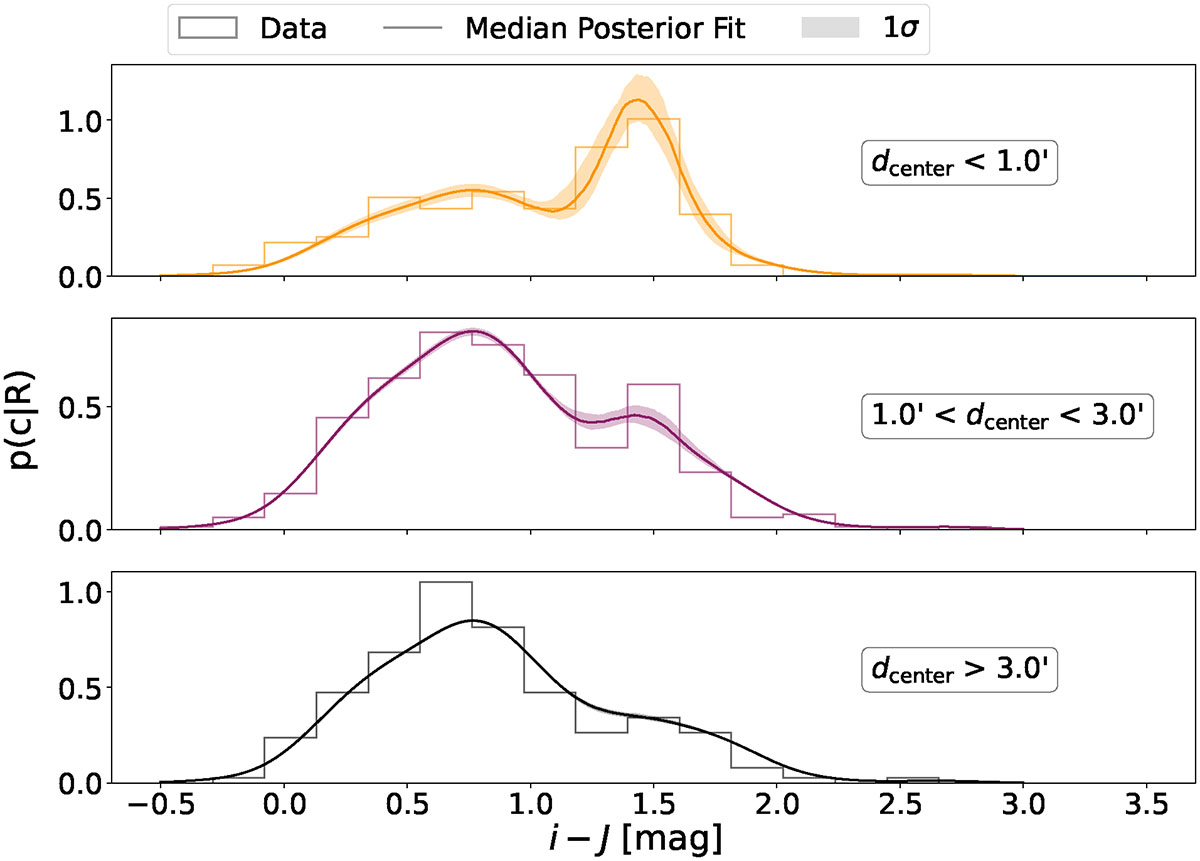
Radial colour distribution of the extracted sources in the field of the cluster 1eRASS J113751.5 + 072839, split into three radial bins with respect to the optical cluster centre: dcentre < 1′ (orange), 1′< dcentre < 3′ (purple), and dcentre > 3′ (black). The histograms show the colour distribution of the data, the curves depict the median fit of the obtained posterior distribution, while the shaded regions show its 1σ uncertainty. The best fitting parameter values are shown in Table 1.
Current usage metrics show cumulative count of Article Views (full-text article views including HTML views, PDF and ePub downloads, according to the available data) and Abstracts Views on Vision4Press platform.
Data correspond to usage on the plateform after 2015. The current usage metrics is available 48-96 hours after online publication and is updated daily on week days.
Initial download of the metrics may take a while.