Open Access
Fig. 7.
Download original image
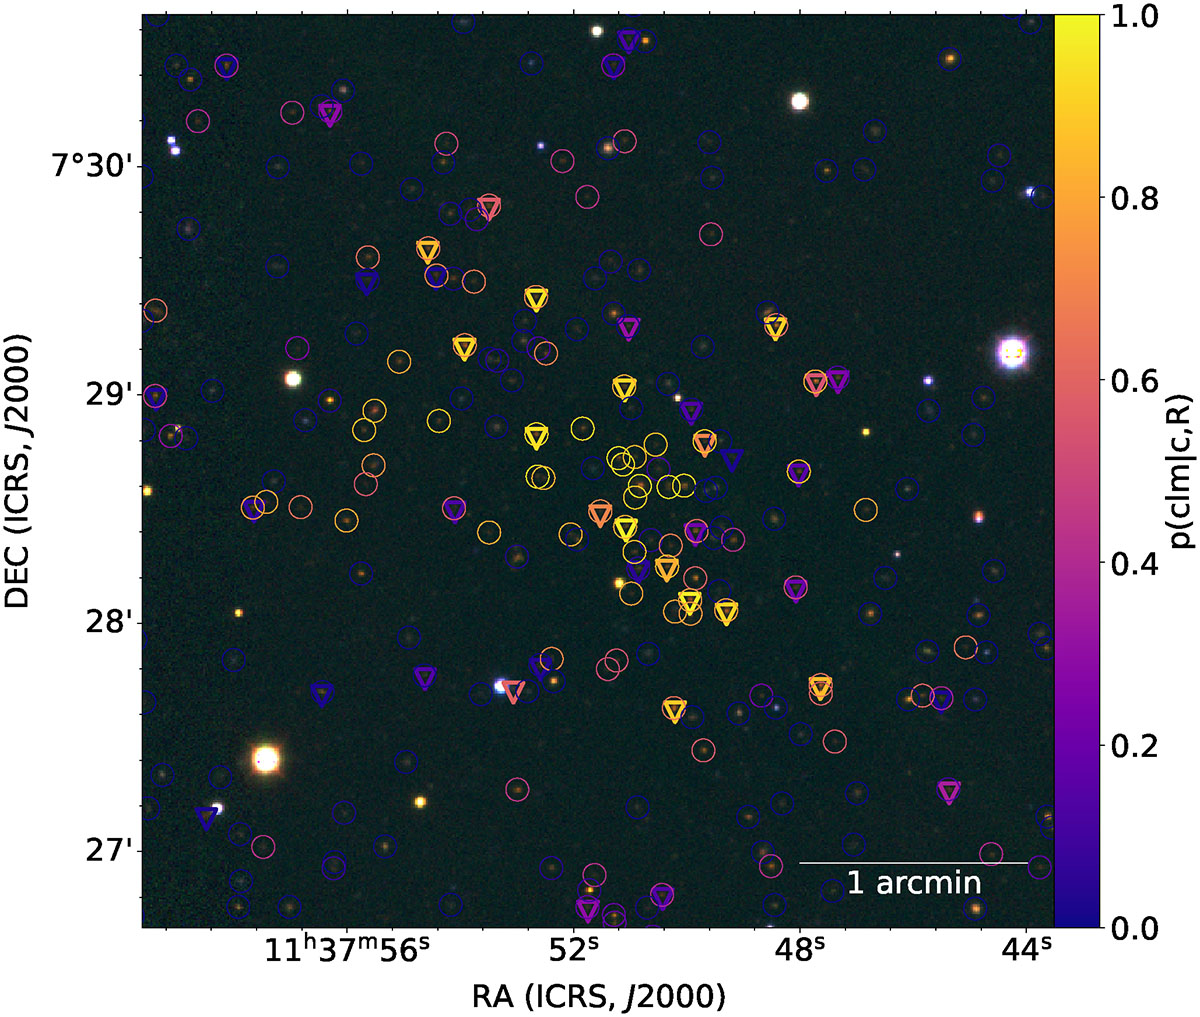
Comparison of sources and their assigned cluster member probability found in this work (colour-coded circles) to the ones reported in Kluge et al. (2024, colour-coded triangles). For better readability, we change the colour-code of cluster probability compared to Fig. 6.
Current usage metrics show cumulative count of Article Views (full-text article views including HTML views, PDF and ePub downloads, according to the available data) and Abstracts Views on Vision4Press platform.
Data correspond to usage on the plateform after 2015. The current usage metrics is available 48-96 hours after online publication and is updated daily on week days.
Initial download of the metrics may take a while.