Fig. 2.
Download original image
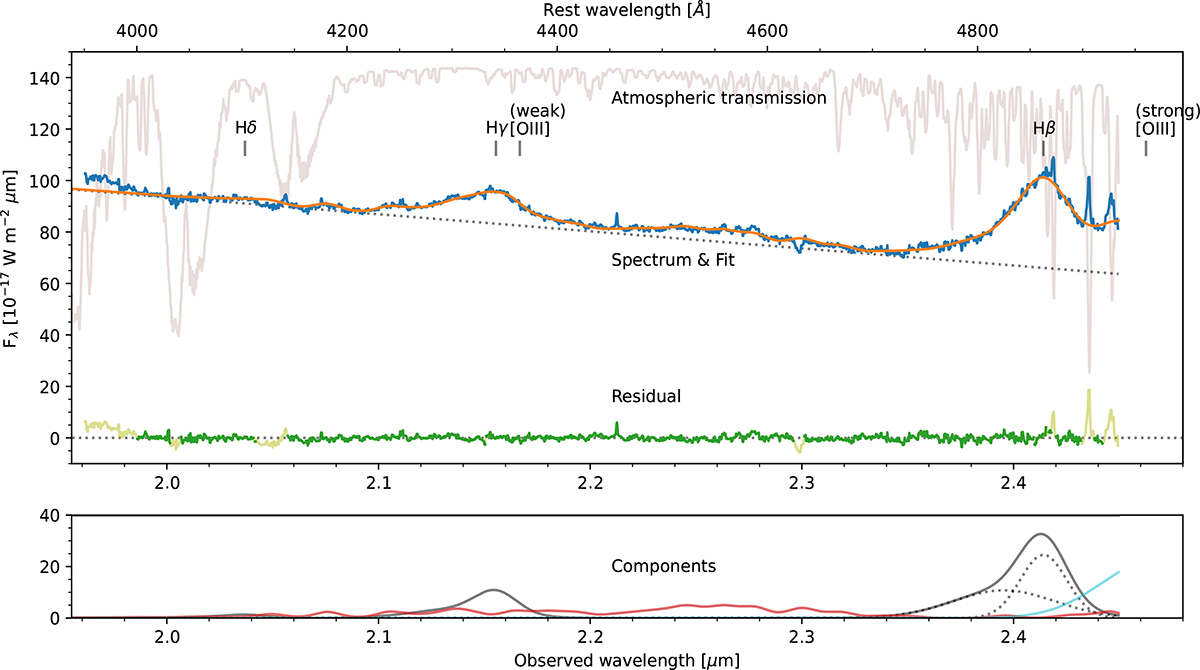
K-band spectrum of J0529 from ERIS. The upper panel shows the data (blue; the narrow features at the long end of the band are due to imperfect atmospheric correction) and the fit (orange), with the H I lines marked (the location of the [O III] lines are also marked; the 4363 Å line is expected to be 10–100 times weaker than those at 4959 Å and 5007 Å, the peaks of which are out of the spectral range). Also shown are the atmospheric transmission and the residual, indicating which regions have been excluded from the fit. The lower panel shows the components of the fit: the H I lines (black), Fe II complex (red), and a component that represents either poor slope correction at the band edge (as seen also at the short end of the band) or a possible blue wing on the [O III] line.
Current usage metrics show cumulative count of Article Views (full-text article views including HTML views, PDF and ePub downloads, according to the available data) and Abstracts Views on Vision4Press platform.
Data correspond to usage on the plateform after 2015. The current usage metrics is available 48-96 hours after online publication and is updated daily on week days.
Initial download of the metrics may take a while.