Fig. 4.
Download original image
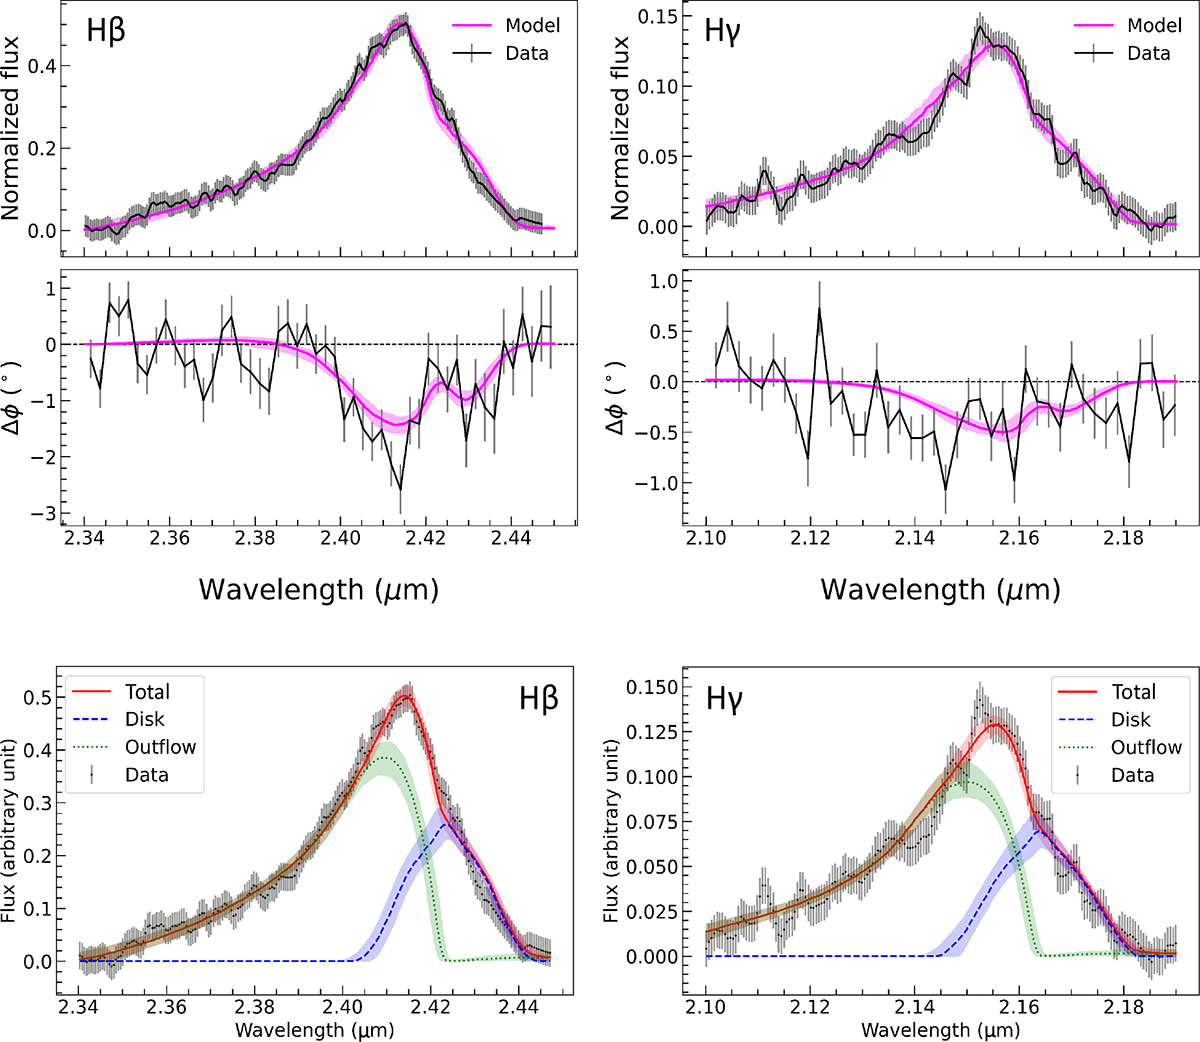
Flux spectrum, averaged differential phase spectra, and line decomposition. Top row: Continuum-subtracted spectrum of the two emission lines and the best-fit model. For each of the Hβ (left) and Hγ (right) lines, the middle row shows the average phase spectra, which are created from the three baselines with the strongest signal (this is for visualisation purposes only; phase spectra for the individual baselines are shown in Fig. A.1). Bottom row: Decomposition of the fitted line profile (red) into the outflow (green) and discy (blue) components. The outflow dominates the total line flux, including much of the apparent core of the line profile.
Current usage metrics show cumulative count of Article Views (full-text article views including HTML views, PDF and ePub downloads, according to the available data) and Abstracts Views on Vision4Press platform.
Data correspond to usage on the plateform after 2015. The current usage metrics is available 48-96 hours after online publication and is updated daily on week days.
Initial download of the metrics may take a while.