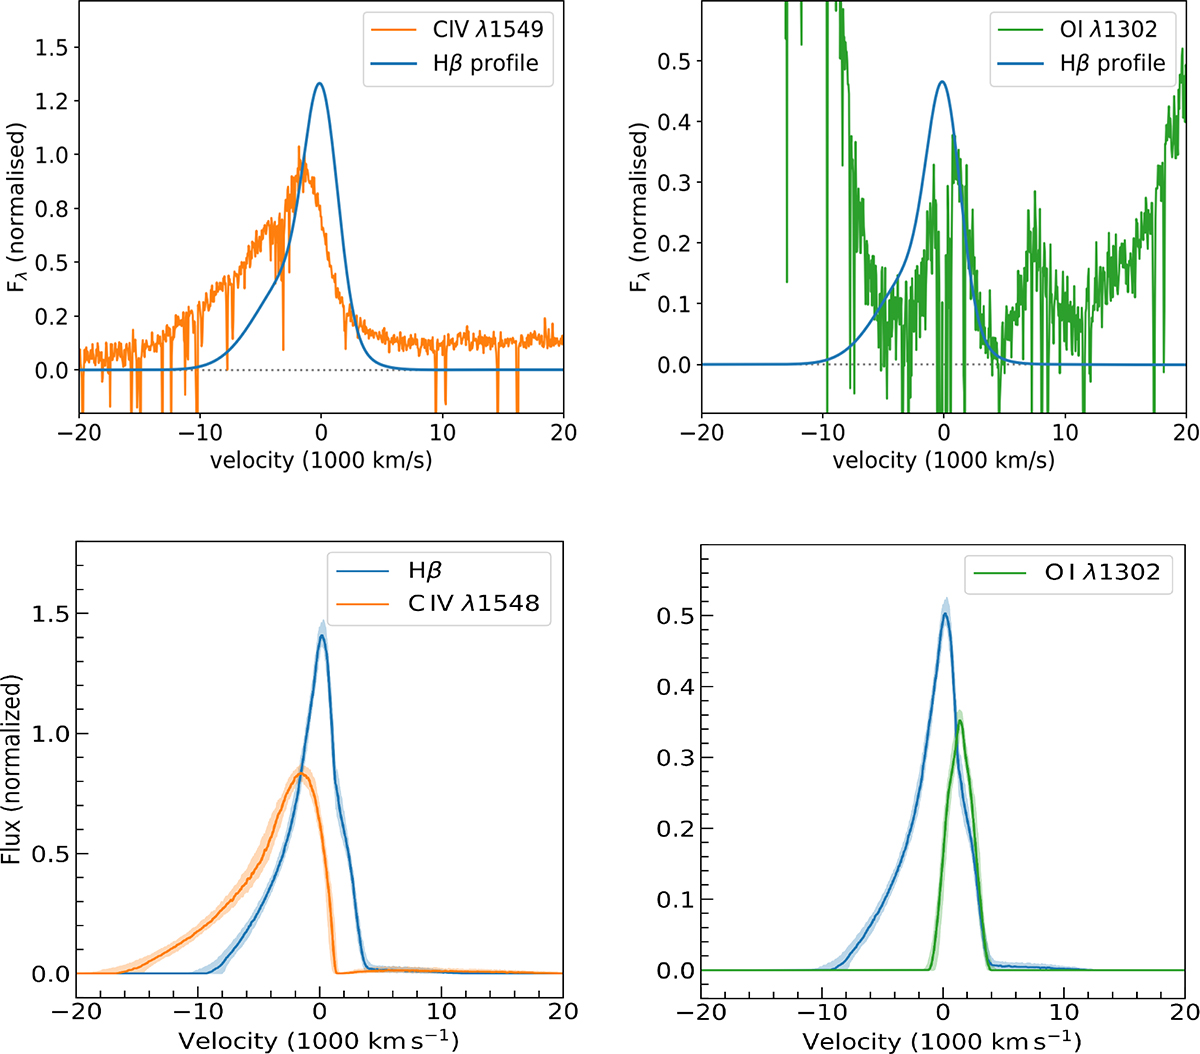
Fig. 6.
Download original image
Comparison of H I profile to C IVλ1549 Å and O Iλ1302 Å. The upper row shows the observed lines from the Xshooter spectrum (Wolf et al. 2024). The velocity zero point here is set at the H I line peak. The normalisation in each panel is adjusted to match at least part of the profile between the fitted H I profile and the line profile in the plotted spectrum. This highlights that the C IV is associated primarily with the BLR outflow and extends to higher velocities, while O I is more associated with the static rotating part of the BLR (the source of the deep absorption at multiple velocities across the line peak is unclear. The lower row shows the model predictions of the C IV (left) O I (right) profiles (independent normalisations), with the velocity zero point also set at the H I line peak. Details of how the predicted line profiles were created are given in Sects. 6.1 and 6.2.
Current usage metrics show cumulative count of Article Views (full-text article views including HTML views, PDF and ePub downloads, according to the available data) and Abstracts Views on Vision4Press platform.
Data correspond to usage on the plateform after 2015. The current usage metrics is available 48-96 hours after online publication and is updated daily on week days.
Initial download of the metrics may take a while.