Open Access
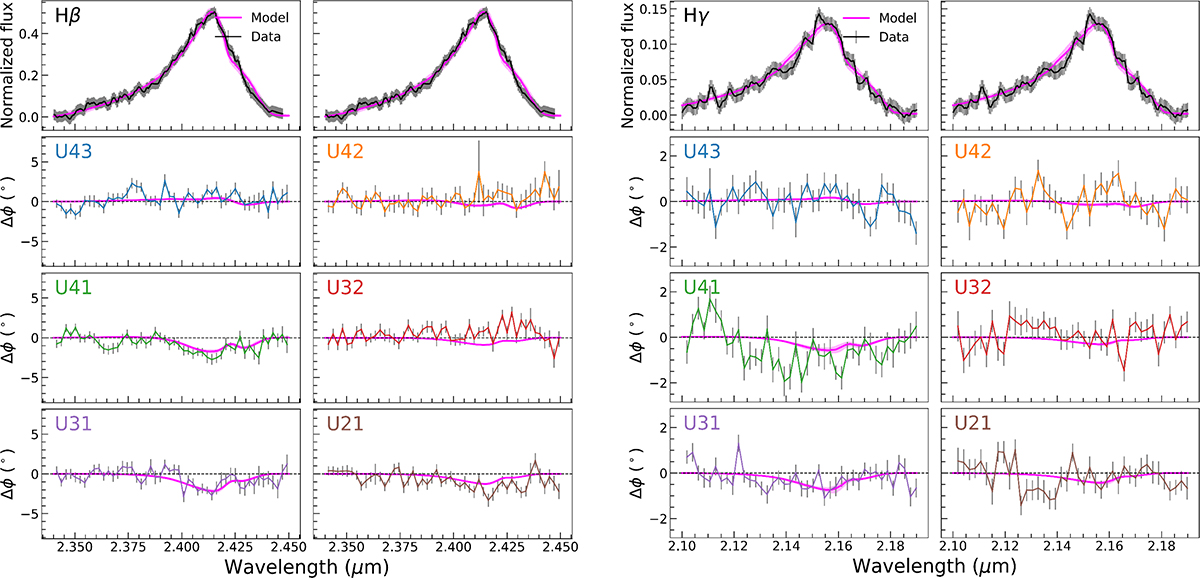
Fig. A.1.
Download original image
Differential phase spectra for individual baselines. For the spectral segments around each of the Hβ and Hγ lines (top row), the measured and fitted differential phases are shown as a function of wavelength (other rows). The three baselines which contain the strongest signal (4-2, 4-1, and 3-1) are combined in Fig. 4.
Current usage metrics show cumulative count of Article Views (full-text article views including HTML views, PDF and ePub downloads, according to the available data) and Abstracts Views on Vision4Press platform.
Data correspond to usage on the plateform after 2015. The current usage metrics is available 48-96 hours after online publication and is updated daily on week days.
Initial download of the metrics may take a while.