Fig. A.3.
Download original image
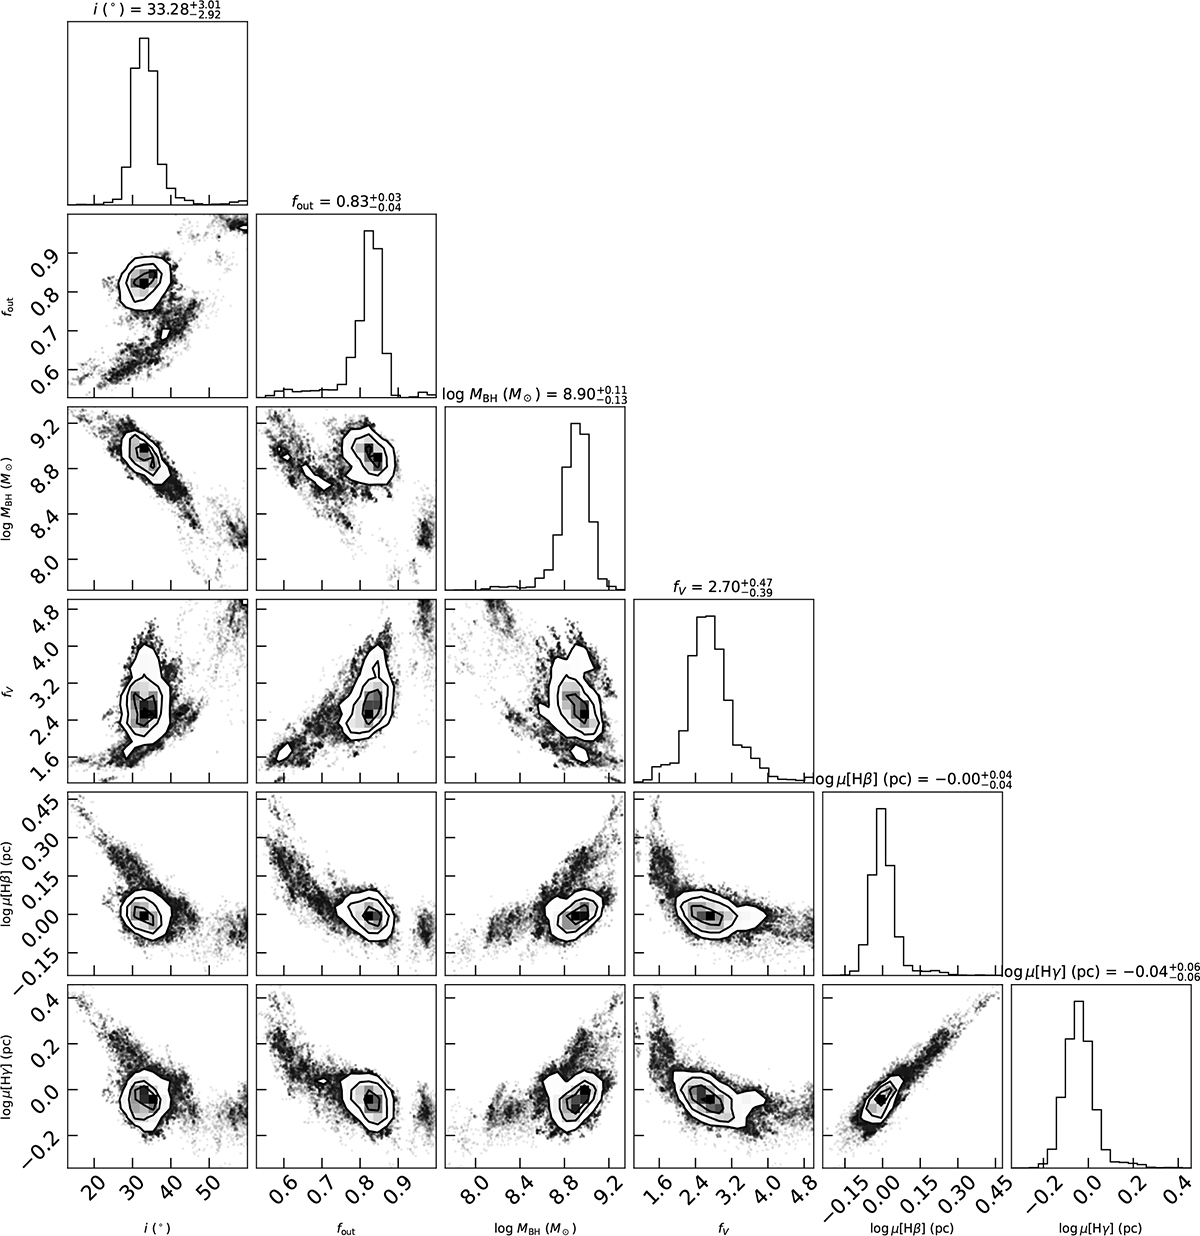
Corner plot of a few key parameters. Four are fitted directly in the model and two are derived afterwards, propagating the uncertainties. The panels show there is a single major peak that is well constrained. They also show that at a low level of significance there are additional minor peaks and some expected correlations (e.g. that between MBH and inclination is easiest to understand, and it leads to adjustment of other parameters).
Current usage metrics show cumulative count of Article Views (full-text article views including HTML views, PDF and ePub downloads, according to the available data) and Abstracts Views on Vision4Press platform.
Data correspond to usage on the plateform after 2015. The current usage metrics is available 48-96 hours after online publication and is updated daily on week days.
Initial download of the metrics may take a while.